

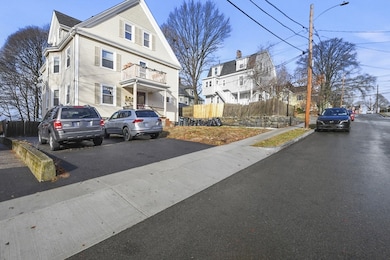


41 Marion St Unit 3 Quincy, MA 02170
Wollaston Neighborhood
2
Beds
1
Bath
1,092
Sq Ft
$259/mo
HOA Fee
Highlights
- Marina
- Golf Course Community
- Wood Flooring
- Central Middle School Rated A-
- Property is near public transit
- 2-minute walk to Safford Park
About This Home
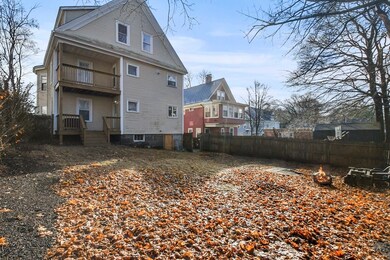
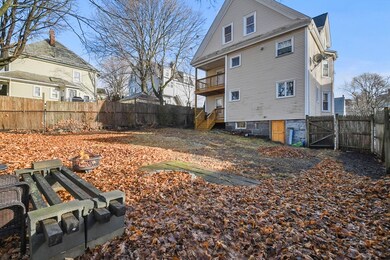
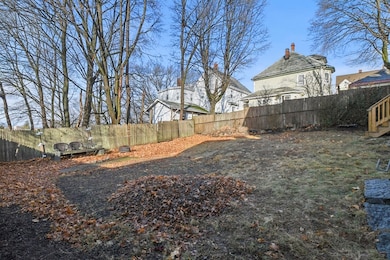
As of February 2025Location, location, location! Welcome home to this wonderfully laid out two bedroom condo in the lovely Wollaston Hill neighborhood of Quincy. With two generously sized bedrooms, a large kitchen with in-unit laundry, an open living room with tons of natural light, and an extra bonus room perfect for an in-home office, the unit has it all! Plenty of on street parking available. The location offers easy access to the Red Line, Wollaston, East Milton Square and more. Wollaston Beach is approximately one mile away. This location is also perfect for those driving into Boston for work or fun! The association shares a large, fenced in back yard, with opportunities for recreation, gardening and more. Room for storage in the basement as well. The location of this unit can’t be beat- close to all Quincy has to offer including Safford Park. The perks of a city with a peaceful, neighborhood feel. Check it out!
Property Details
Home Type
- Condominium
Est. Annual Taxes
- $4,082
Year Built
- Built in 1900
Lot Details
- Fenced Yard
- Fenced
HOA Fees
- $259 Monthly HOA Fees
Interior Spaces
- 1,092 Sq Ft Home
- 1-Story Property
- Ceiling Fan
- Bonus Room
- Basement
Kitchen
- Range
- Microwave
- Dishwasher
- Disposal
Flooring
- Wood
- Laminate
- Tile
Bedrooms and Bathrooms
- 2 Bedrooms
- Primary bedroom located on third floor
- 1 Full Bathroom
Laundry
- Laundry in unit
- Dryer
- Washer
Parking
- On-Street Parking
- Open Parking
Location
- Property is near public transit
- Property is near schools
Schools
- Wollaston Elementary School
- Central Middle School
- NQHS High School
Utilities
- Window Unit Cooling System
- 1 Heating Zone
- Heating System Uses Oil
- Baseboard Heating
- High Speed Internet
Listing and Financial Details
- Legal Lot and Block 3 / 4
- Assessor Parcel Number M:5178 B:4 L:3,4505177
Community Details
Overview
- Association fees include insurance, reserve funds
- 3 Units
Recreation
- Marina
- Golf Course Community
- Park
Pet Policy
- Pets Allowed
Ownership History
Date
Name
Owned For
Owner Type
Purchase Details
Listed on
Jan 7, 2025
Closed on
Feb 18, 2025
Sold by
Leeber James T
Bought by
Hunt Jeremy and Velleca Holly
Seller's Agent
Nicole Vermillion
Lamacchia Realty, Inc.
Buyer's Agent
Xavier Vargas
Vicente Realty, LLC
List Price
$449,000
Sold Price
$449,000
Views
34
Current Estimated Value
Home Financials for this Owner
Home Financials are based on the most recent Mortgage that was taken out on this home.
Estimated Appreciation
-$851
Avg. Annual Appreciation
-0.36%
Original Mortgage
$404,100
Outstanding Balance
$401,868
Interest Rate
5.5%
Mortgage Type
Purchase Money Mortgage
Estimated Equity
$46,281
Purchase Details
Listed on
Sep 6, 2022
Closed on
Dec 21, 2022
Sold by
Jones Justin
Bought by
Leeber James T
Seller's Agent
Greg Richard
Realty Executives Boston West
Buyer's Agent
Casey Cochran
Coldwell Banker Realty - Boston
List Price
$419,000
Sold Price
$355,000
Premium/Discount to List
-$64,000
-15.27%
Views
153
Home Financials for this Owner
Home Financials are based on the most recent Mortgage that was taken out on this home.
Avg. Annual Appreciation
11.49%
Original Mortgage
$284,000
Interest Rate
7.08%
Mortgage Type
Purchase Money Mortgage
Purchase Details
Listed on
Aug 27, 2020
Closed on
Oct 20, 2020
Sold by
Hill Janice E
Bought by
Jones Justin
Seller's Agent
Austin Partain
William Raveis R.E. & Home Services
Buyer's Agent
Greg Richard
Realty Executives Boston West
List Price
$325,000
Sold Price
$325,000
Home Financials for this Owner
Home Financials are based on the most recent Mortgage that was taken out on this home.
Avg. Annual Appreciation
4.17%
Original Mortgage
$305,000
Interest Rate
2.8%
Mortgage Type
New Conventional
Purchase Details
Listed on
Sep 14, 2015
Closed on
Nov 16, 2015
Sold by
Rodrigues David and Pimental Christopher
Bought by
Hill Janice E
Seller's Agent
Richard Lannon
Keller Williams Realty
Buyer's Agent
Austin Partain
William Raveis R.E. & Home Services
List Price
$225,000
Sold Price
$218,000
Premium/Discount to List
-$7,000
-3.11%
Home Financials for this Owner
Home Financials are based on the most recent Mortgage that was taken out on this home.
Avg. Annual Appreciation
8.42%
Original Mortgage
$206,000
Interest Rate
3.87%
Mortgage Type
New Conventional
Purchase Details
Listed on
Jun 11, 2013
Closed on
Jan 9, 2014
Sold by
Edwards Natasha R
Bought by
Rodrigues David and Pimentel Christopher
Seller's Agent
Kathleen Alexander
Keller Williams Realty Boston-Metro | Back Bay
Buyer's Agent
Patrick Brusil
Keller Williams Realty Boston-Metro | Back Bay
List Price
$183,000
Sold Price
$180,000
Premium/Discount to List
-$3,000
-1.64%
Home Financials for this Owner
Home Financials are based on the most recent Mortgage that was taken out on this home.
Avg. Annual Appreciation
10.85%
Original Mortgage
$176,668
Interest Rate
4.29%
Mortgage Type
FHA
Purchase Details
Closed on
Nov 26, 2004
Sold by
Pouliot Donald J
Bought by
Edwards Natasha R
Similar Homes in Quincy, MA
Create a Home Valuation Report for This Property
The Home Valuation Report is an in-depth analysis detailing your home's value as well as a comparison with similar homes in the area
Home Values in the Area
Average Home Value in this Area
Purchase History
| Date | Type | Sale Price | Title Company |
|---|---|---|---|
| Condominium Deed | $449,000 | None Available | |
| Condominium Deed | $449,000 | None Available | |
| Condominium Deed | $355,000 | None Available | |
| Condominium Deed | $355,000 | None Available | |
| Not Resolvable | $325,000 | None Available | |
| Not Resolvable | $218,000 | -- | |
| Not Resolvable | $180,000 | -- | |
| Deed | $245,000 | -- | |
| Deed | $245,000 | -- |
Source: Public Records
Mortgage History
| Date | Status | Loan Amount | Loan Type |
|---|---|---|---|
| Open | $404,100 | Purchase Money Mortgage | |
| Closed | $404,100 | Purchase Money Mortgage | |
| Previous Owner | $284,000 | Purchase Money Mortgage | |
| Previous Owner | $305,000 | New Conventional | |
| Previous Owner | $206,000 | New Conventional | |
| Previous Owner | $176,166 | FHA | |
| Previous Owner | $176,668 | FHA |
Source: Public Records
Property History
| Date | Event | Price | Change | Sq Ft Price |
|---|---|---|---|---|
| 02/18/2025 02/18/25 | Sold | $449,000 | 0.0% | $411 / Sq Ft |
| 01/13/2025 01/13/25 | Pending | -- | -- | -- |
| 01/07/2025 01/07/25 | For Sale | $449,000 | 0.0% | $411 / Sq Ft |
| 12/29/2024 12/29/24 | Off Market | $2,800 | -- | -- |
| 11/25/2024 11/25/24 | For Rent | $2,800 | 0.0% | -- |
| 12/21/2022 12/21/22 | Sold | $355,000 | -3.8% | $325 / Sq Ft |
| 12/01/2022 12/01/22 | Pending | -- | -- | -- |
| 11/01/2022 11/01/22 | Price Changed | $369,000 | -1.6% | $338 / Sq Ft |
| 09/23/2022 09/23/22 | Price Changed | $375,000 | -6.0% | $343 / Sq Ft |
| 09/13/2022 09/13/22 | Price Changed | $399,000 | -4.8% | $365 / Sq Ft |
| 09/06/2022 09/06/22 | For Sale | $419,000 | +28.9% | $384 / Sq Ft |
| 10/23/2020 10/23/20 | Sold | $325,000 | 0.0% | $298 / Sq Ft |
| 09/01/2020 09/01/20 | Pending | -- | -- | -- |
| 08/27/2020 08/27/20 | For Sale | $325,000 | +49.1% | $298 / Sq Ft |
| 11/16/2015 11/16/15 | Sold | $218,000 | 0.0% | $200 / Sq Ft |
| 09/28/2015 09/28/15 | Off Market | $218,000 | -- | -- |
| 09/28/2015 09/28/15 | Pending | -- | -- | -- |
| 09/14/2015 09/14/15 | For Sale | $225,000 | +25.0% | $206 / Sq Ft |
| 01/06/2014 01/06/14 | Sold | $180,000 | 0.0% | $165 / Sq Ft |
| 12/30/2013 12/30/13 | Pending | -- | -- | -- |
| 11/03/2013 11/03/13 | Off Market | $180,000 | -- | -- |
| 10/23/2013 10/23/13 | For Sale | $183,000 | +1.7% | $168 / Sq Ft |
| 09/28/2013 09/28/13 | Pending | -- | -- | -- |
| 09/12/2013 09/12/13 | Off Market | $180,000 | -- | -- |
| 07/26/2013 07/26/13 | Price Changed | $183,000 | -8.0% | $168 / Sq Ft |
| 06/11/2013 06/11/13 | For Sale | $199,000 | -- | $182 / Sq Ft |
Source: MLS Property Information Network (MLS PIN)
Tax History Compared to Growth
Tax History
| Year | Tax Paid | Tax Assessment Tax Assessment Total Assessment is a certain percentage of the fair market value that is determined by local assessors to be the total taxable value of land and additions on the property. | Land | Improvement |
|---|---|---|---|---|
| 2025 | $4,225 | $366,400 | $0 | $366,400 |
| 2024 | $4,082 | $362,200 | $0 | $362,200 |
| 2023 | $3,675 | $330,200 | $0 | $330,200 |
| 2022 | $4,001 | $334,000 | $0 | $334,000 |
| 2021 | $3,093 | $254,800 | $0 | $254,800 |
| 2020 | $3,106 | $249,900 | $0 | $249,900 |
| 2019 | $2,863 | $228,100 | $0 | $228,100 |
| 2018 | $2,823 | $211,600 | $0 | $211,600 |
| 2017 | $2,840 | $200,400 | $0 | $200,400 |
| 2016 | $2,616 | $182,200 | $0 | $182,200 |
| 2015 | $3,103 | $212,500 | $0 | $212,500 |
| 2014 | $4,269 | $287,300 | $0 | $287,300 |
Source: Public Records
Agents Affiliated with this Home
-
Nicole Vermillion
Seller's Agent in 2025
Nicole Vermillion
Lamacchia Realty, Inc.
(857) 939-9055
1 in this area
165 Total Sales
-
Xavier Vargas
Buyer's Agent in 2025
Xavier Vargas
Vicente Realty, LLC
(508) 863-5004
1 in this area
46 Total Sales
-
Greg Richard
Seller's Agent in 2022
Greg Richard
Realty Executives
(508) 341-7528
2 in this area
80 Total Sales
-
Casey Cochran
Buyer's Agent in 2022
Casey Cochran
Coldwell Banker Realty - Boston
(617) 615-5955
1 in this area
157 Total Sales
-
Austin Partain
Seller's Agent in 2020
Austin Partain
William Raveis R.E. & Home Services
(617) 903-0736
8 in this area
183 Total Sales
-
Richard Lannon
Seller's Agent in 2015
Richard Lannon
Keller Williams Realty
(617) 571-8510
1 in this area
75 Total Sales
Map
Source: MLS Property Information Network (MLS PIN)
MLS Number: 73323679
APN: QUIN-005178-000004-000003
Disclaimer: Certain information contained herein is derived from information provided by parties other than Homes.com. All information provided is deemed reliable, but is not guaranteed to be accurate and should be independently verified.
![]() The property listing data and information, or the Images, set forth herein were provided to MLS Property Information Network, Inc. from third party sources, including sellers, lessors and public records, and were compiled by MLS Property Information Network, Inc. The property listing data and information, and the Images, are for the personal, non-commercial use of consumers having a good faith interest in purchasing or leasing listed properties of the type displayed to them and may not be used for any purpose other than to identify prospective properties which such consumers may have a good faith interest in purchasing or leasing. MLS Property Information Network, Inc. and its subscribers disclaim any and all representations and warranties as to the accuracy of the property listing data and information, or as to the accuracy of any of the Images, set forth herein.
The property listing data and information, or the Images, set forth herein were provided to MLS Property Information Network, Inc. from third party sources, including sellers, lessors and public records, and were compiled by MLS Property Information Network, Inc. The property listing data and information, and the Images, are for the personal, non-commercial use of consumers having a good faith interest in purchasing or leasing listed properties of the type displayed to them and may not be used for any purpose other than to identify prospective properties which such consumers may have a good faith interest in purchasing or leasing. MLS Property Information Network, Inc. and its subscribers disclaim any and all representations and warranties as to the accuracy of the property listing data and information, or as to the accuracy of any of the Images, set forth herein.
Nearby Homes
- 225 S Central Ave
- 22 Newton Ave
- 10 Weston Ave Unit 324
- 163 Clay St Unit 3
- 163 Clay St Unit 2
- 204 Farrington St
- 143 Arlington St
- 22 Beach St
- 21 Linden St Unit 304
- 21 Linden St Unit 318
- 21 Linden St Unit 210
- 45 Oval Rd Unit 24
- 511 Hancock St Unit 207
- 522 Hancock St
- 103 Wilson Ave
- 98 Safford St
- 26 Buckingham Rd
- 70 Sherman St
- 47 Miles Dr
- 83 Forbes Hill Rd