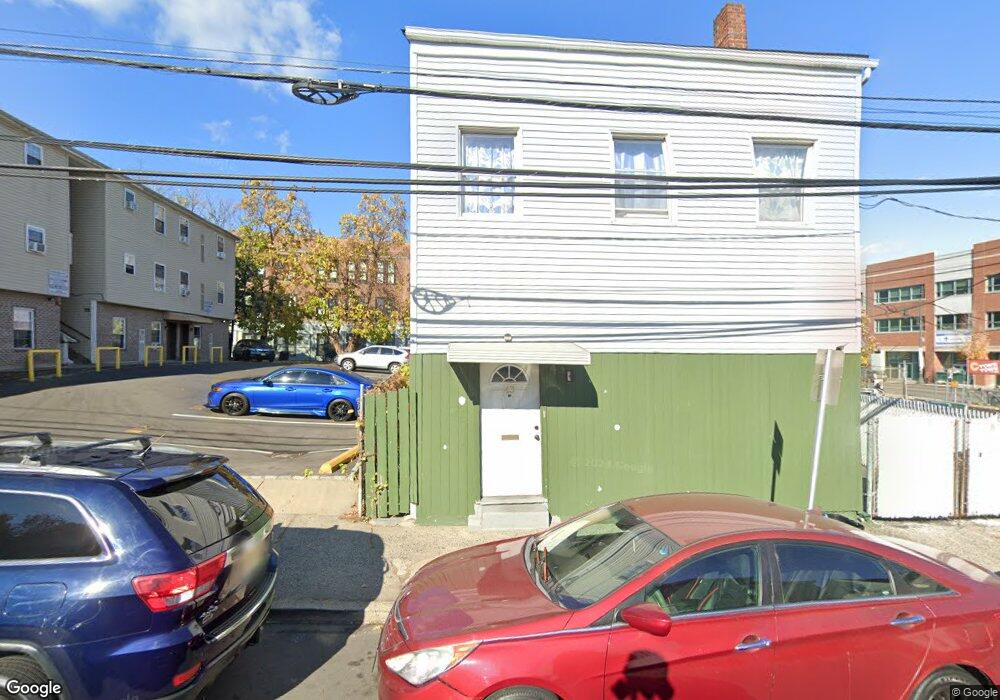
41 Mary St Paterson, NJ 07503
South Paterson NeighborhoodEstimated Value: $656,000
--
Bed
--
Bath
--
Sq Ft
3,354
Sq Ft Lot
About This Home
This home is located at 41 Mary St, Paterson, NJ 07503 and is currently estimated at $656,000. 41 Mary St is a home with nearby schools including Dale Avenue Elementary School, Edward W. Kilpatrick School of Discovery, and Paterson Public School No. 3.
Ownership History
Date
Name
Owned For
Owner Type
Purchase Details
Closed on
Aug 7, 2013
Sold by
Waterfall Victoria Mortgage Trust 2011 S
Bought by
3541 Mary Apartments Llc
Current Estimated Value
Home Financials for this Owner
Home Financials are based on the most recent Mortgage that was taken out on this home.
Original Mortgage
$937,500
Interest Rate
4.31%
Mortgage Type
Commercial
Purchase Details
Closed on
Jun 6, 2013
Sold by
Asfour Nora and Asfour Adnan
Bought by
Waterfall Victoria Mortgage Trust 2011 S
Create a Home Valuation Report for This Property
The Home Valuation Report is an in-depth analysis detailing your home's value as well as a comparison with similar homes in the area
Home Values in the Area
Average Home Value in this Area
Purchase History
| Date | Buyer | Sale Price | Title Company |
|---|---|---|---|
| 3541 Mary Apartments Llc | $1,250,000 | Westcor Land Title Ins Co | |
| Waterfall Victoria Mortgage Trust 2011 S | $75,000 | Agent For Old Republic Natio |
Source: Public Records
Mortgage History
| Date | Status | Borrower | Loan Amount |
|---|---|---|---|
| Previous Owner | 3541 Mary Apartments Llc | $937,500 |
Source: Public Records
Tax History Compared to Growth
Tax History
| Year | Tax Paid | Tax Assessment Tax Assessment Total Assessment is a certain percentage of the fair market value that is determined by local assessors to be the total taxable value of land and additions on the property. | Land | Improvement |
|---|---|---|---|---|
| 2025 | $1,702 | $33,400 | $25,900 | $7,500 |
| 2024 | $1,638 | $33,400 | $25,900 | $7,500 |
| 2022 | $1,550 | $33,400 | $25,900 | $7,500 |
| 2021 | $1,495 | $33,400 | $25,900 | $7,500 |
| 2020 | $1,394 | $33,400 | $25,900 | $7,500 |
| 2019 | $1,381 | $33,400 | $25,900 | $7,500 |
| 2018 | $1,376 | $31,800 | $25,900 | $5,900 |
| 2017 | $1,231 | $29,600 | $25,900 | $3,700 |
| 2016 | $1,284 | $29,600 | $25,900 | $3,700 |
| 2015 | $1,216 | $29,600 | $25,900 | $3,700 |
| 2014 | $1,354 | $46,700 | $40,000 | $6,700 |
Source: Public Records
Map
Nearby Homes