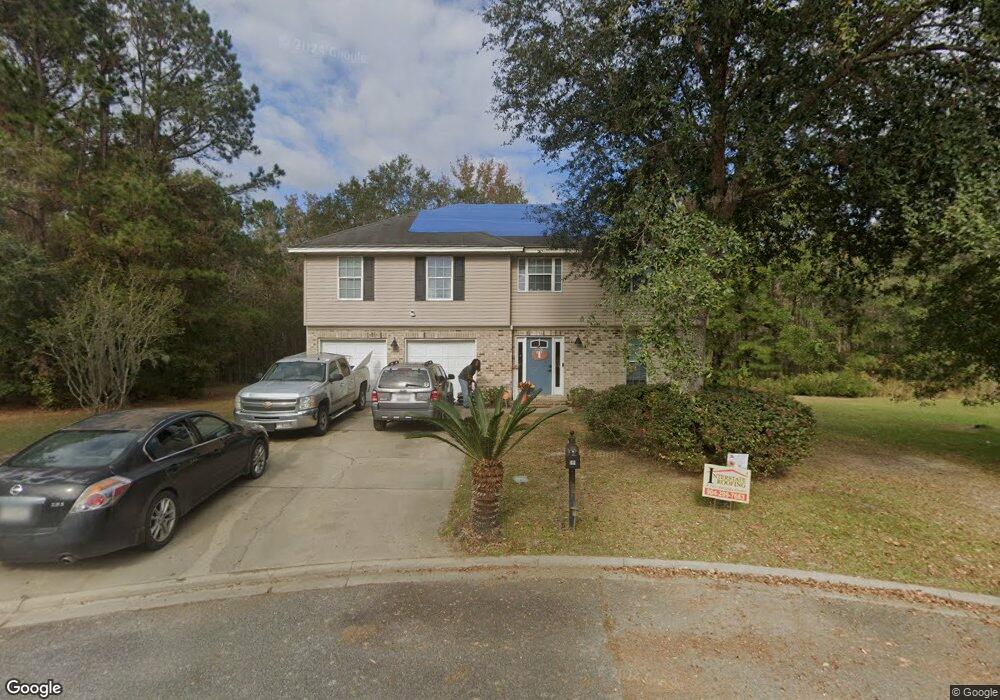
41 Mulberry Run Ct Midway, GA 31320
Estimated Value: $310,000 - $336,042
3
Beds
3
Baths
2,313
Sq Ft
$139/Sq Ft
Est. Value
About This Home
This home is located at 41 Mulberry Run Ct, Midway, GA 31320 and is currently estimated at $321,011, approximately $138 per square foot. 41 Mulberry Run Ct is a home located in Liberty County with nearby schools including Liberty Elementary School, Midway Middle School, and Liberty County High School.
Ownership History
Date
Name
Owned For
Owner Type
Purchase Details
Closed on
Nov 20, 2019
Sold by
Watts Michael
Bought by
Tillman Jermaine M
Current Estimated Value
Home Financials for this Owner
Home Financials are based on the most recent Mortgage that was taken out on this home.
Original Mortgage
$182,631
Outstanding Balance
$161,170
Interest Rate
4.12%
Mortgage Type
FHA
Estimated Equity
$159,841
Purchase Details
Closed on
May 24, 2007
Sold by
Colster Christopher A
Bought by
Watts Michael
Home Financials for this Owner
Home Financials are based on the most recent Mortgage that was taken out on this home.
Original Mortgage
$196,500
Interest Rate
7.4%
Mortgage Type
New Conventional
Purchase Details
Closed on
Jul 13, 2005
Sold by
Colster Christopher A
Bought by
Colster Christopher A and Colster Dawn E
Home Financials for this Owner
Home Financials are based on the most recent Mortgage that was taken out on this home.
Original Mortgage
$181,382
Interest Rate
5.59%
Mortgage Type
VA
Purchase Details
Closed on
Jun 21, 2004
Sold by
Marlo Development Inc
Bought by
Jcw Construction Llc
Create a Home Valuation Report for This Property
The Home Valuation Report is an in-depth analysis detailing your home's value as well as a comparison with similar homes in the area
Home Values in the Area
Average Home Value in this Area
Purchase History
| Date | Buyer | Sale Price | Title Company |
|---|---|---|---|
| Tillman Jermaine M | $186,000 | -- | |
| Watts Michael | $196,500 | -- | |
| Colster Christopher A | -- | -- | |
| Colster Christopher A | $177,565 | -- | |
| Jcw Construction Llc | $475,000 | -- |
Source: Public Records
Mortgage History
| Date | Status | Borrower | Loan Amount |
|---|---|---|---|
| Open | Tillman Jermaine M | $182,631 | |
| Previous Owner | Watts Michael | $196,500 | |
| Previous Owner | Colster Christopher A | $181,382 |
Source: Public Records
Tax History Compared to Growth
Tax History
| Year | Tax Paid | Tax Assessment Tax Assessment Total Assessment is a certain percentage of the fair market value that is determined by local assessors to be the total taxable value of land and additions on the property. | Land | Improvement |
|---|---|---|---|---|
| 2024 | $2,918 | $106,668 | $12,000 | $94,668 |
| 2023 | $2,918 | $95,597 | $12,000 | $83,597 |
| 2022 | $2,563 | $77,929 | $10,000 | $67,929 |
| 2021 | $2,475 | $70,917 | $10,000 | $60,917 |
| 2020 | $2,638 | $67,288 | $10,000 | $57,288 |
| 2019 | $2,430 | $63,520 | $10,000 | $53,520 |
| 2018 | $2,423 | $64,108 | $10,000 | $54,108 |
| 2017 | $3,035 | $71,534 | $10,000 | $61,534 |
| 2016 | $2,536 | $72,195 | $10,000 | $62,195 |
| 2015 | $2,947 | $72,195 | $10,000 | $62,195 |
| 2014 | $2,947 | $83,216 | $10,000 | $73,216 |
| 2013 | -- | $74,224 | $10,000 | $64,224 |
Source: Public Records
Map
Nearby Homes
- 327 River Bend Dr
- 364 River Bend Dr
- 296 River Bend Dr
- 90 Charleston Ct
- 0 E Oglethorpe Unit SA341930
- 0 E Oglethorpe Unit 153327
- 0 E Oglethorpe Unit 10592168
- 8701 E Oglethorpe Hwy
- 0000 E Oglethorpe Hwy
- 182 Gloucester Dr
- 29 Sassafras Ln
- 0 S Coastal Hwy
- 92 Lachlan Ln
- 670 Stone Ct
- 35 Hollis Ln
- 152 Holland Dr
- 1019 Stone Ct
- 94 Buckingham Dr
- 1099 Stone Ct
- 1057 Stone Ct
- 42 Mulberry Run Ct
- 31 Mulberry Run Ct
- 30 Mulberry Run Ct
- 129 River Bend Dr
- 155 River Bend Dr
- 29 Carolina Ash Ct
- 111 River Bend Dr
- 173 River Bend Dr
- 93 River Bend Dr
- 39 Carolina Ash Ct
- 146 River Bend Dr
- 128 River Bend Dr
- 164 River Bend Dr
- 108 River Bend Dr
- 182 River Bend Dr
- 73 River Bend Dr
- 28 Carolina Ash Ct
- 92 River Bend Dr
- 202 River Bend Dr
- 223 River Bend Dr