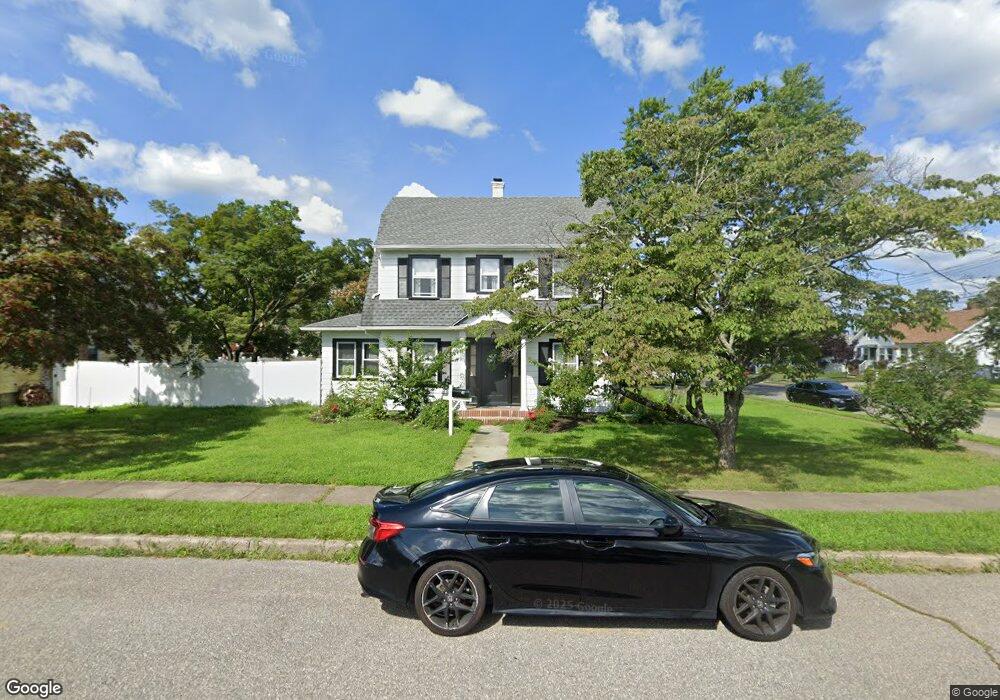
41 N Gateway Toms River, NJ 08753
Estimated Value: $488,000 - $581,000
3
Beds
2
Baths
2,954
Sq Ft
$183/Sq Ft
Est. Value
About This Home
This home is located at 41 N Gateway, Toms River, NJ 08753 and is currently estimated at $541,191, approximately $183 per square foot. 41 N Gateway is a home located in Ocean County with nearby schools including St Joseph Grade School, Ambassador Christian Academy, and Donovan Catholic High School.
Ownership History
Date
Name
Owned For
Owner Type
Purchase Details
Closed on
Apr 1, 2024
Sold by
Sheriff Of The County Of Ocean
Bought by
210 Dls Seven Sml Llc
Current Estimated Value
Purchase Details
Closed on
Jan 21, 2016
Sold by
Norton Kathleen
Bought by
Norton Kathleen
Purchase Details
Closed on
May 26, 2004
Sold by
Norton Kathleen and Bierach Erik
Bought by
Norton Kathleen and Bierach Erik
Home Financials for this Owner
Home Financials are based on the most recent Mortgage that was taken out on this home.
Original Mortgage
$220,150
Interest Rate
6.3%
Mortgage Type
Purchase Money Mortgage
Create a Home Valuation Report for This Property
The Home Valuation Report is an in-depth analysis detailing your home's value as well as a comparison with similar homes in the area
Home Values in the Area
Average Home Value in this Area
Purchase History
| Date | Buyer | Sale Price | Title Company |
|---|---|---|---|
| 210 Dls Seven Sml Llc | $314,088 | Madison Title | |
| 210 Dls Seven Sml Llc | $314,088 | Madison Title | |
| Norton Kathleen | -- | -- | |
| Norton Kathleen | -- | None Available |
Source: Public Records
Mortgage History
| Date | Status | Borrower | Loan Amount |
|---|---|---|---|
| Previous Owner | Norton Kathleen | $220,150 |
Source: Public Records
Tax History Compared to Growth
Tax History
| Year | Tax Paid | Tax Assessment Tax Assessment Total Assessment is a certain percentage of the fair market value that is determined by local assessors to be the total taxable value of land and additions on the property. | Land | Improvement |
|---|---|---|---|---|
| 2025 | $7,370 | $404,700 | $124,000 | $280,700 |
| 2024 | $7,005 | $404,700 | $124,000 | $280,700 |
| 2023 | $6,754 | $404,700 | $124,000 | $280,700 |
| 2022 | $6,754 | $404,700 | $124,000 | $280,700 |
| 2021 | $6,012 | $240,000 | $85,800 | $154,200 |
| 2020 | $5,986 | $240,000 | $85,800 | $154,200 |
| 2019 | $5,726 | $240,000 | $85,800 | $154,200 |
| 2018 | $5,650 | $240,000 | $85,800 | $154,200 |
| 2017 | $5,602 | $240,000 | $85,800 | $154,200 |
| 2016 | $5,455 | $240,000 | $85,800 | $154,200 |
| 2015 | $5,249 | $240,000 | $85,800 | $154,200 |
| 2014 | $4,997 | $240,000 | $85,800 | $154,200 |
Source: Public Records
Map
Nearby Homes