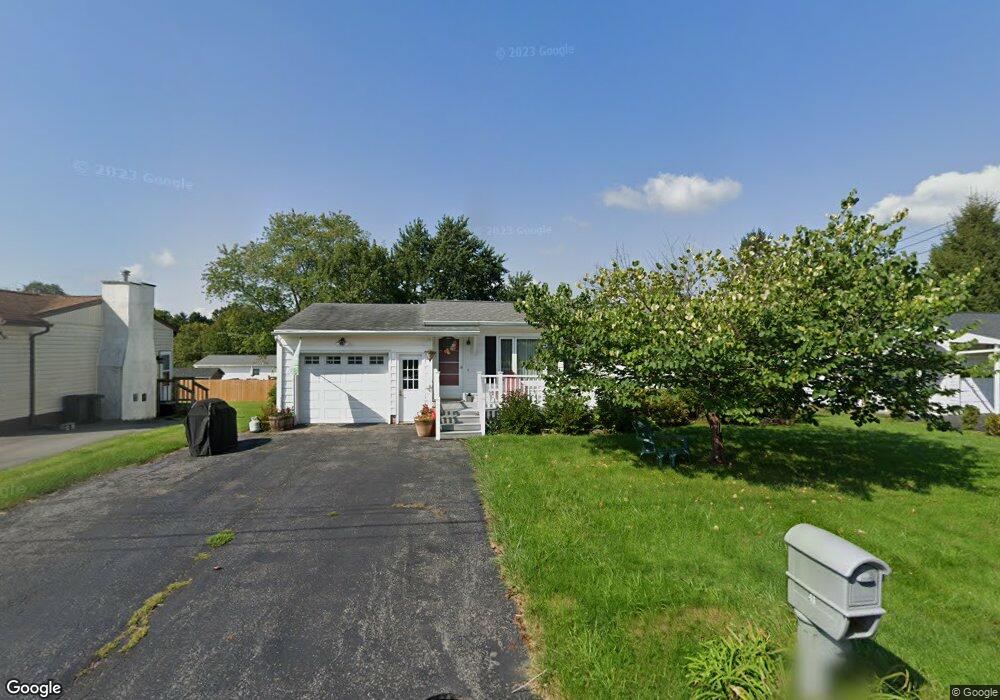
41 Oak St Auburn, NY 13021
Estimated Value: $187,000 - $213,000
3
Beds
1
Bath
960
Sq Ft
$208/Sq Ft
Est. Value
About This Home
This home is located at 41 Oak St, Auburn, NY 13021 and is currently estimated at $200,045, approximately $208 per square foot. 41 Oak St is a home located in Cayuga County with nearby schools including Auburn Junior High School, Auburn High School, and Creative Minds Montessori School.
Ownership History
Date
Name
Owned For
Owner Type
Purchase Details
Closed on
Apr 23, 2010
Sold by
Saurini Robert M and Saurini Jodi L
Bought by
Buck Kelly D
Current Estimated Value
Home Financials for this Owner
Home Financials are based on the most recent Mortgage that was taken out on this home.
Original Mortgage
$102,335
Outstanding Balance
$68,159
Interest Rate
5%
Mortgage Type
New Conventional
Estimated Equity
$131,886
Purchase Details
Closed on
Mar 13, 2000
Sold by
Pelmear John H
Bought by
Saurini Robert
Purchase Details
Closed on
Dec 27, 1995
Create a Home Valuation Report for This Property
The Home Valuation Report is an in-depth analysis detailing your home's value as well as a comparison with similar homes in the area
Home Values in the Area
Average Home Value in this Area
Purchase History
| Date | Buyer | Sale Price | Title Company |
|---|---|---|---|
| Buck Kelly D | $105,500 | None Available | |
| Saurini Robert | $55,000 | Charles Lynch | |
| -- | -- | -- |
Source: Public Records
Mortgage History
| Date | Status | Borrower | Loan Amount |
|---|---|---|---|
| Open | Buck Kelly D | $102,335 |
Source: Public Records
Tax History Compared to Growth
Tax History
| Year | Tax Paid | Tax Assessment Tax Assessment Total Assessment is a certain percentage of the fair market value that is determined by local assessors to be the total taxable value of land and additions on the property. | Land | Improvement |
|---|---|---|---|---|
| 2024 | $3,166 | $135,800 | $20,400 | $115,400 |
| 2023 | $3,163 | $135,800 | $20,400 | $115,400 |
| 2022 | $2,661 | $135,800 | $20,400 | $115,400 |
| 2021 | $2,426 | $108,800 | $16,400 | $92,400 |
| 2020 | $2,389 | $108,800 | $16,400 | $92,400 |
| 2019 | $925 | $108,800 | $16,400 | $92,400 |
| 2018 | $2,301 | $108,800 | $16,400 | $92,400 |
| 2017 | $2,296 | $104,200 | $17,500 | $86,700 |
| 2016 | $2,767 | $104,200 | $17,500 | $86,700 |
| 2015 | $1,219 | $104,200 | $17,500 | $86,700 |
| 2014 | $1,219 | $104,200 | $17,500 | $86,700 |
Source: Public Records
Map
Nearby Homes