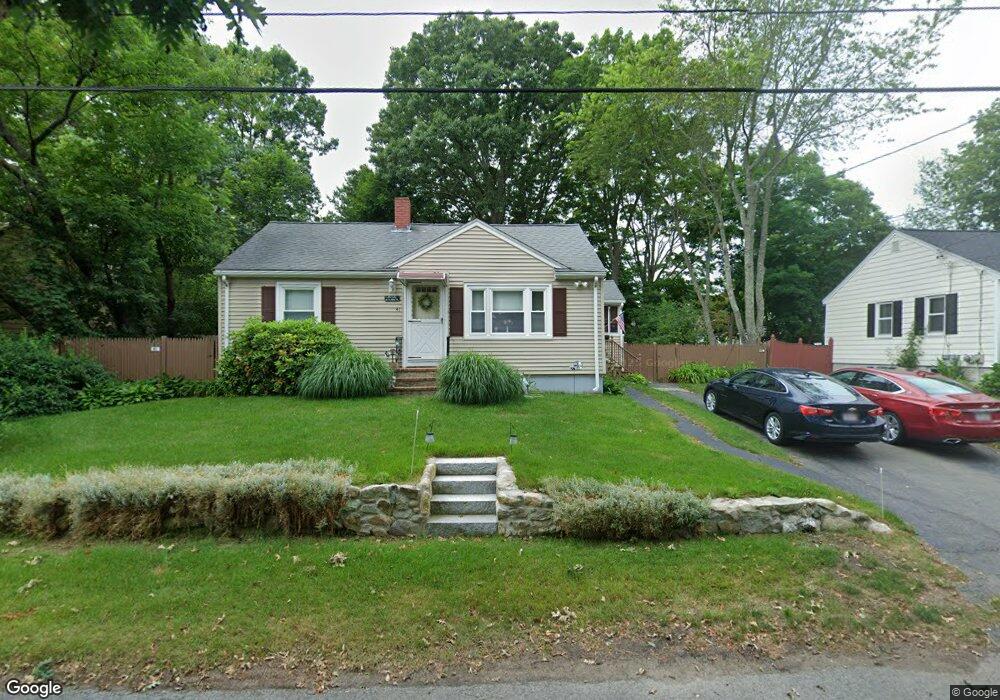
41 Olson St Abington, MA 02351
Estimated Value: $417,316 - $435,000
2
Beds
1
Bath
854
Sq Ft
$500/Sq Ft
Est. Value
About This Home
This home is located at 41 Olson St, Abington, MA 02351 and is currently estimated at $427,329, approximately $500 per square foot. 41 Olson St is a home located in Plymouth County with nearby schools including Beaver Brook Elementary School, Abington Middle School, and Woodsdale School.
Ownership History
Date
Name
Owned For
Owner Type
Purchase Details
Closed on
May 18, 1993
Sold by
Czyrklis Cheryl A and Czyrklis Christopher
Bought by
Murphy Kevin P and Murphy Thomas J
Current Estimated Value
Home Financials for this Owner
Home Financials are based on the most recent Mortgage that was taken out on this home.
Original Mortgage
$96,750
Interest Rate
7.47%
Mortgage Type
Purchase Money Mortgage
Purchase Details
Closed on
Mar 26, 1987
Sold by
Pacetti Richard A
Bought by
Czyrklis Christopher J
Home Financials for this Owner
Home Financials are based on the most recent Mortgage that was taken out on this home.
Original Mortgage
$112,400
Interest Rate
9.03%
Mortgage Type
Purchase Money Mortgage
Create a Home Valuation Report for This Property
The Home Valuation Report is an in-depth analysis detailing your home's value as well as a comparison with similar homes in the area
Home Values in the Area
Average Home Value in this Area
Purchase History
| Date | Buyer | Sale Price | Title Company |
|---|---|---|---|
| Murphy Kevin P | $107,500 | -- | |
| Czyrklis Christopher J | $124,900 | -- |
Source: Public Records
Mortgage History
| Date | Status | Borrower | Loan Amount |
|---|---|---|---|
| Open | Czyrklis Christopher J | $90,000 | |
| Closed | Czyrklis Christopher J | $96,750 | |
| Previous Owner | Czyrklis Christopher J | $15,000 | |
| Previous Owner | Czyrklis Christopher J | $112,400 |
Source: Public Records
Tax History
| Year | Tax Paid | Tax Assessment Tax Assessment Total Assessment is a certain percentage of the fair market value that is determined by local assessors to be the total taxable value of land and additions on the property. | Land | Improvement |
|---|---|---|---|---|
| 2025 | $4,884 | $374,000 | $212,000 | $162,000 |
| 2024 | $4,592 | $343,200 | $192,700 | $150,500 |
| 2023 | $4,726 | $332,600 | $167,600 | $165,000 |
| 2022 | $4,592 | $301,700 | $146,600 | $155,100 |
| 2021 | $4,431 | $268,900 | $133,000 | $135,900 |
| 2020 | $4,609 | $271,100 | $139,600 | $131,500 |
| 2019 | $4,132 | $237,600 | $133,000 | $104,600 |
| 2018 | $4,182 | $234,700 | $133,000 | $101,700 |
| 2017 | $3,899 | $212,500 | $133,000 | $79,500 |
| 2016 | $3,582 | $199,800 | $126,700 | $73,100 |
| 2015 | $3,290 | $193,500 | $126,700 | $66,800 |
Source: Public Records
Map
Nearby Homes
Your Personal Tour Guide
Ask me questions while you tour the home.