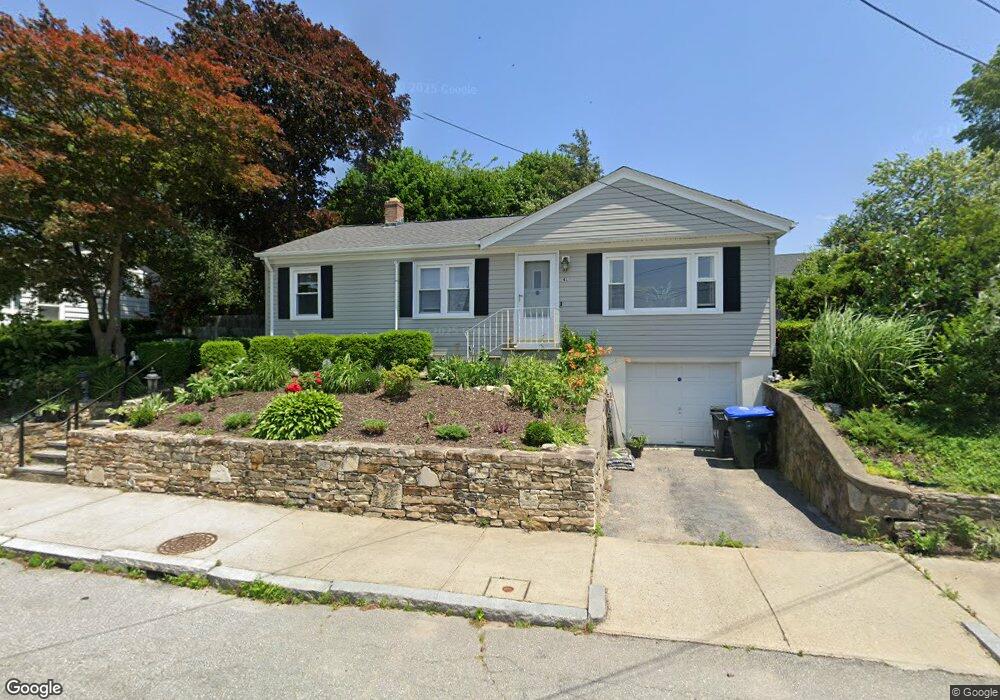
41 Parente St Providence, RI 02904
Charles NeighborhoodEstimated Value: $414,308 - $515,000
3
Beds
2
Baths
1,808
Sq Ft
$248/Sq Ft
Est. Value
About This Home
This home is located at 41 Parente St, Providence, RI 02904 and is currently estimated at $447,827, approximately $247 per square foot. 41 Parente St is a home located in Providence County with nearby schools including Times Squared Academy, Times2 Elementary School, and Times2 Middle/High School.
Ownership History
Date
Name
Owned For
Owner Type
Purchase Details
Closed on
Apr 27, 2000
Sold by
Paquin Cacar J and Paquin Patricia A
Bought by
Wooten Gary S
Current Estimated Value
Home Financials for this Owner
Home Financials are based on the most recent Mortgage that was taken out on this home.
Original Mortgage
$94,403
Interest Rate
8.23%
Create a Home Valuation Report for This Property
The Home Valuation Report is an in-depth analysis detailing your home's value as well as a comparison with similar homes in the area
Home Values in the Area
Average Home Value in this Area
Purchase History
| Date | Buyer | Sale Price | Title Company |
|---|---|---|---|
| Wooten Gary S | $96,000 | -- |
Source: Public Records
Mortgage History
| Date | Status | Borrower | Loan Amount |
|---|---|---|---|
| Open | Wooten Gary S | $134,000 | |
| Closed | Wooten Gary S | $118,600 | |
| Closed | Wooten Gary S | $94,552 | |
| Closed | Wooten Gary S | $94,403 |
Source: Public Records
Tax History
| Year | Tax Paid | Tax Assessment Tax Assessment Total Assessment is a certain percentage of the fair market value that is determined by local assessors to be the total taxable value of land and additions on the property. | Land | Improvement |
|---|---|---|---|---|
| 2025 | $2,890 | $344,100 | $131,400 | $212,700 |
| 2024 | $4,991 | $272,000 | $86,300 | $185,700 |
| 2023 | $4,991 | $272,000 | $86,300 | $185,700 |
| 2022 | $4,842 | $272,000 | $86,300 | $185,700 |
| 2021 | $4,794 | $195,200 | $66,400 | $128,800 |
| 2020 | $4,794 | $195,200 | $66,400 | $128,800 |
| 2019 | $4,794 | $195,200 | $66,400 | $128,800 |
| 2018 | $4,391 | $137,400 | $51,300 | $86,100 |
| 2017 | $4,391 | $137,400 | $51,300 | $86,100 |
| 2016 | $4,391 | $137,400 | $51,300 | $86,100 |
| 2015 | $4,310 | $130,200 | $51,900 | $78,300 |
| 2014 | $4,394 | $130,200 | $51,900 | $78,300 |
| 2013 | $4,394 | $130,200 | $51,900 | $78,300 |
Source: Public Records
Map
Nearby Homes
Your Personal Tour Guide
Ask me questions while you tour the home.