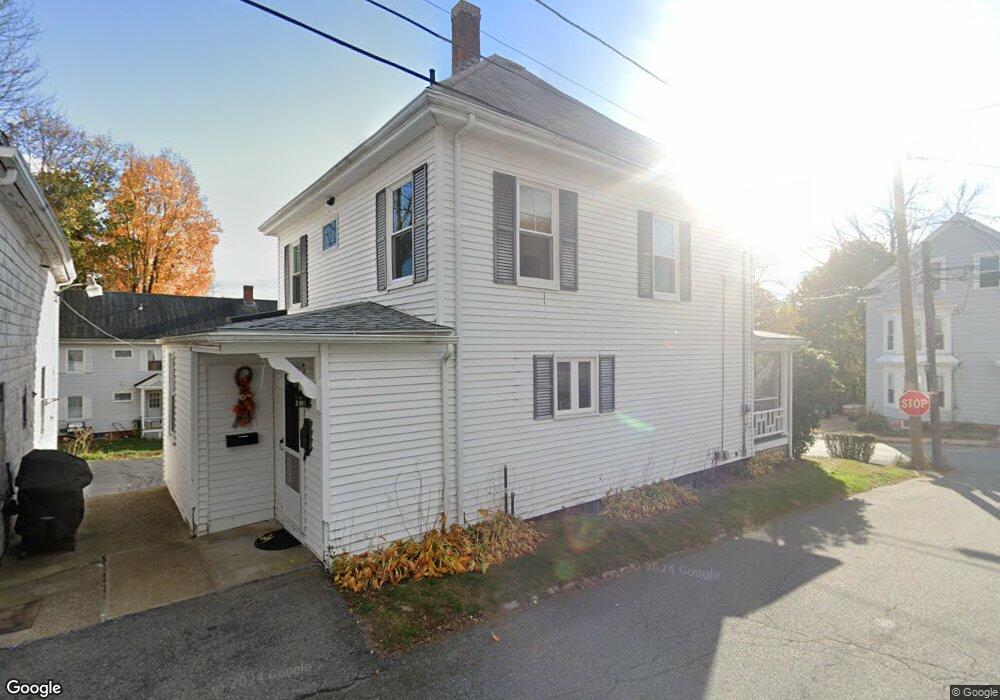
41 Powow St Amesbury, MA 01913
Estimated Value: $557,000 - $699,000
3
Beds
1
Bath
1,615
Sq Ft
$384/Sq Ft
Est. Value
About This Home
This home is located at 41 Powow St, Amesbury, MA 01913 and is currently estimated at $620,514, approximately $384 per square foot. 41 Powow St is a home located in Essex County with nearby schools including Amesbury High School and Amesbury Seventh-Day Adventist School.
Ownership History
Date
Name
Owned For
Owner Type
Purchase Details
Closed on
May 4, 2015
Sold by
Smedstad Emily A
Bought by
Smedstad Ft
Current Estimated Value
Purchase Details
Closed on
Jan 13, 2014
Sold by
Et Nt
Bought by
Smedstad Emily A
Purchase Details
Closed on
Aug 7, 1981
Bought by
Smedstad Emily Ann
Create a Home Valuation Report for This Property
The Home Valuation Report is an in-depth analysis detailing your home's value as well as a comparison with similar homes in the area
Home Values in the Area
Average Home Value in this Area
Purchase History
| Date | Buyer | Sale Price | Title Company |
|---|---|---|---|
| Smedstad Ft | -- | -- | |
| Smedstad Emily A | -- | -- | |
| Smedstad Emily Ann | -- | -- |
Source: Public Records
Mortgage History
| Date | Status | Borrower | Loan Amount |
|---|---|---|---|
| Previous Owner | Smedstad Emily Ann | $25,000 | |
| Previous Owner | Smedstad Emily Ann | $48,000 | |
| Previous Owner | Smedstad Emily Ann | $33,000 |
Source: Public Records
Tax History Compared to Growth
Tax History
| Year | Tax Paid | Tax Assessment Tax Assessment Total Assessment is a certain percentage of the fair market value that is determined by local assessors to be the total taxable value of land and additions on the property. | Land | Improvement |
|---|---|---|---|---|
| 2025 | $7,687 | $502,400 | $198,000 | $304,400 |
| 2024 | $7,368 | $471,100 | $186,800 | $284,300 |
| 2023 | $6,796 | $415,900 | $162,400 | $253,500 |
| 2022 | $6,556 | $370,600 | $141,200 | $229,400 |
| 2021 | $5,988 | $328,100 | $109,100 | $219,000 |
| 2020 | $5,353 | $311,600 | $104,900 | $206,700 |
| 2019 | $5,480 | $298,300 | $104,900 | $193,400 |
| 2018 | $5,317 | $280,000 | $99,900 | $180,100 |
| 2017 | $5,480 | $274,700 | $99,900 | $174,800 |
| 2016 | $5,382 | $265,400 | $99,900 | $165,500 |
| 2015 | $5,316 | $258,800 | $99,900 | $158,900 |
| 2014 | $5,207 | $248,300 | $98,700 | $149,600 |
Source: Public Records
Map
Nearby Homes
- 48 Orchard St
- 17 Linwood Place
- 101 Market St Unit B
- 101 Market St Unit A
- 103 Market St Unit A
- 103 Market St Unit B
- 105 Market St Unit B
- 81 High St Unit 27
- 53 Market St
- 37 Millyard Unit 204
- 25 Cedar St Unit 4
- 25 Cedar St Unit 7
- 5 Richs Ct Unit 3
- 97 Elm St
- 24 Aubin St Unit 2
- 19 Perkins St
- 43 Aubin St Unit 1
- 4 Lincoln Ct
- 3 Glenwood St
- 13 Lincoln Ct