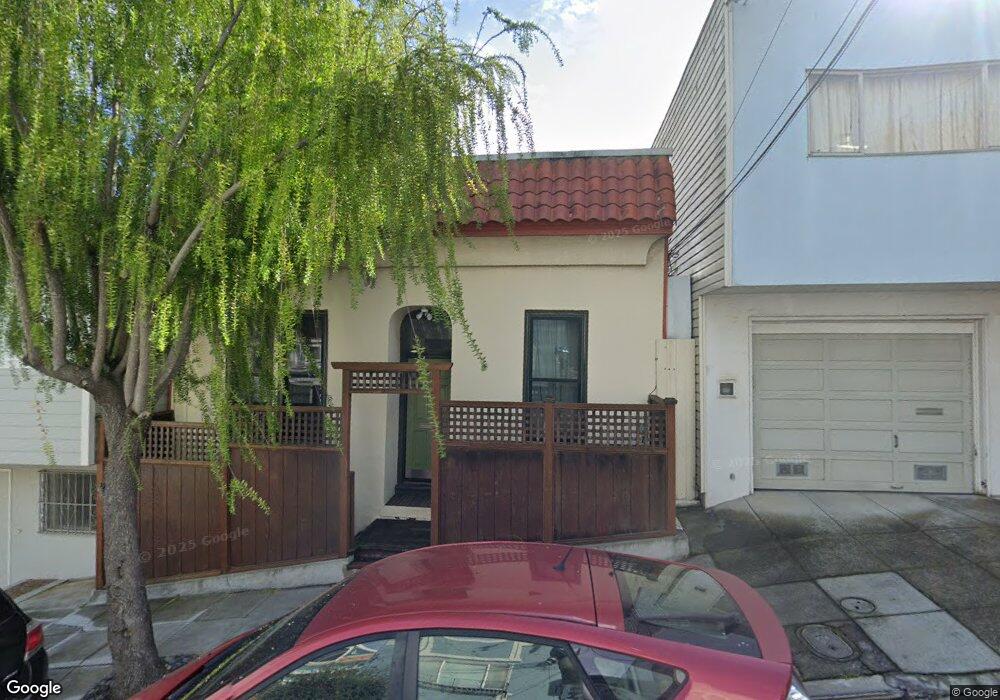
41 Putnam St San Francisco, CA 94110
Bernal Heights NeighborhoodEstimated Value: $1,175,000 - $1,286,563
3
Beds
1
Bath
1,125
Sq Ft
$1,084/Sq Ft
Est. Value
About This Home
This home is located at 41 Putnam St, San Francisco, CA 94110 and is currently estimated at $1,219,891, approximately $1,084 per square foot. 41 Putnam St is a home located in San Francisco County with nearby schools including Leonard R. Flynn Elementary, James Lick Middle School, and Donum Dei Classical Academy.
Ownership History
Date
Name
Owned For
Owner Type
Purchase Details
Closed on
Feb 20, 2010
Sold by
Hovenden Fiona and Ross Richard
Bought by
Ross Richard D and Hovenden Fiona
Current Estimated Value
Purchase Details
Closed on
Nov 11, 2003
Sold by
Bernardo Damiano A and Bernardo Dahlia F
Bought by
Ross Richard and Hovenden Fiona
Home Financials for this Owner
Home Financials are based on the most recent Mortgage that was taken out on this home.
Original Mortgage
$370,000
Outstanding Balance
$157,974
Interest Rate
4.87%
Mortgage Type
Purchase Money Mortgage
Estimated Equity
$1,061,918
Purchase Details
Closed on
Aug 15, 1997
Sold by
Bernardo Jose P and Bernardo Lucila A
Bought by
Bernardo Damiano A and Bernardo Dahlia F
Create a Home Valuation Report for This Property
The Home Valuation Report is an in-depth analysis detailing your home's value as well as a comparison with similar homes in the area
Home Values in the Area
Average Home Value in this Area
Purchase History
| Date | Buyer | Sale Price | Title Company |
|---|---|---|---|
| Ross Richard D | -- | None Available | |
| Ross Richard | $472,500 | Alliance Title | |
| Bernardo Damiano A | -- | -- |
Source: Public Records
Mortgage History
| Date | Status | Borrower | Loan Amount |
|---|---|---|---|
| Open | Ross Richard | $370,000 |
Source: Public Records
Tax History Compared to Growth
Tax History
| Year | Tax Paid | Tax Assessment Tax Assessment Total Assessment is a certain percentage of the fair market value that is determined by local assessors to be the total taxable value of land and additions on the property. | Land | Improvement |
|---|---|---|---|---|
| 2025 | $8,422 | $671,777 | $403,071 | $268,706 |
| 2024 | $8,422 | $658,606 | $395,168 | $263,438 |
| 2023 | $8,288 | $645,693 | $387,420 | $258,273 |
| 2022 | $8,118 | $633,033 | $379,824 | $253,209 |
| 2021 | $7,970 | $620,622 | $372,377 | $248,245 |
| 2020 | $8,018 | $614,259 | $368,559 | $245,700 |
| 2019 | $7,745 | $602,216 | $361,333 | $240,883 |
| 2018 | $7,484 | $590,409 | $354,249 | $236,160 |
| 2017 | $7,095 | $578,833 | $347,303 | $231,530 |
| 2016 | $6,961 | $567,485 | $340,494 | $226,991 |
| 2015 | $6,873 | $558,962 | $335,380 | $223,582 |
| 2014 | $6,691 | $548,014 | $328,811 | $219,203 |
Source: Public Records
Map
Nearby Homes