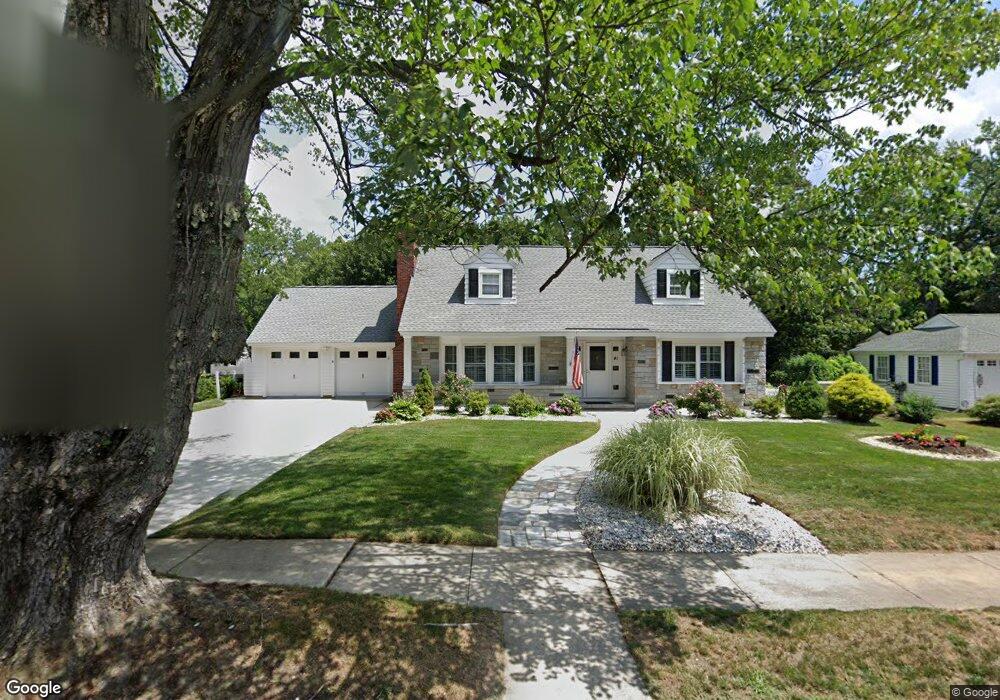
41 Raymond St Nashua, NH 03064
North End Nashua NeighborhoodEstimated Value: $669,349 - $730,000
4
Beds
3
Baths
2,138
Sq Ft
$322/Sq Ft
Est. Value
About This Home
This home is located at 41 Raymond St, Nashua, NH 03064 and is currently estimated at $689,087, approximately $322 per square foot. 41 Raymond St is a home located in Hillsborough County with nearby schools including Mount Pleasant Elementary School, Pennichuck Middle School, and Nashua High School North.
Ownership History
Date
Name
Owned For
Owner Type
Purchase Details
Closed on
Apr 15, 2021
Sold by
Prieto Karen L
Bought by
Karen L Prrieto 2004 Ret and Prieto
Current Estimated Value
Home Financials for this Owner
Home Financials are based on the most recent Mortgage that was taken out on this home.
Original Mortgage
$191,500
Interest Rate
3%
Mortgage Type
New Conventional
Purchase Details
Closed on
Apr 15, 2020
Sold by
Karen L Prieto 2004 Ret and Prieto
Bought by
Prieto Karen L
Home Financials for this Owner
Home Financials are based on the most recent Mortgage that was taken out on this home.
Original Mortgage
$191,500
Interest Rate
3%
Mortgage Type
New Conventional
Create a Home Valuation Report for This Property
The Home Valuation Report is an in-depth analysis detailing your home's value as well as a comparison with similar homes in the area
Home Values in the Area
Average Home Value in this Area
Purchase History
| Date | Buyer | Sale Price | Title Company |
|---|---|---|---|
| Karen L Prrieto 2004 Ret | -- | None Available | |
| Karen L Prrieto 2004 Ret | -- | None Available | |
| Prieto Karen L | -- | None Available | |
| Prieto Karen L | -- | None Available |
Source: Public Records
Mortgage History
| Date | Status | Borrower | Loan Amount |
|---|---|---|---|
| Previous Owner | Karen L Prrieto 2004 Ret | $191,500 | |
| Previous Owner | Prieto Karen L | $191,500 |
Source: Public Records
Tax History Compared to Growth
Tax History
| Year | Tax Paid | Tax Assessment Tax Assessment Total Assessment is a certain percentage of the fair market value that is determined by local assessors to be the total taxable value of land and additions on the property. | Land | Improvement |
|---|---|---|---|---|
| 2024 | $10,553 | $663,700 | $197,600 | $466,100 |
| 2023 | $9,797 | $537,400 | $151,200 | $386,200 |
| 2022 | $9,711 | $537,400 | $151,200 | $386,200 |
| 2021 | $9,713 | $418,300 | $134,700 | $283,600 |
| 2020 | $9,456 | $418,200 | $134,700 | $283,500 |
| 2019 | $9,100 | $418,200 | $134,700 | $283,500 |
| 2018 | $8,870 | $418,200 | $134,700 | $283,500 |
| 2017 | $8,431 | $326,900 | $124,600 | $202,300 |
| 2016 | $8,195 | $326,900 | $124,600 | $202,300 |
| 2015 | $8,019 | $326,900 | $124,600 | $202,300 |
| 2014 | $7,862 | $326,900 | $124,600 | $202,300 |
Source: Public Records
Map
Nearby Homes
- 71 Concord St
- 21 Edson St
- 36-38 Courtland St
- 19 Bartlett Ave
- 46 Perham St Unit 214
- 4 Reservoir St
- 11 Juliana Ave Unit 52
- 19 Atherton Ave
- 31 Juliana Ave
- 31 Juliana Ave Unit 4
- 15 Atherton Ave
- 12 Juliana Ave Unit 14
- 3 Opal Way Unit 3
- 1 Opal Way Unit 1
- 2 Opal Way Unit 2
- 9 Doveton Ln Unit B
- 113 Concord St
- 13 Sapphire Ln
- 1 Shoreline Dr Unit 16
- 434 Abbott Farm Ln