41 Robbins Rd Thompson, CT 06277
Estimated Value: $382,000 - $536,000
3
Beds
2
Baths
1,868
Sq Ft
$243/Sq Ft
Est. Value
About This Home
This home is located at 41 Robbins Rd, Thompson, CT 06277 and is currently estimated at $453,947, approximately $243 per square foot. 41 Robbins Rd is a home located in Windham County with nearby schools including Mary R. Fisher Elementary School, Thompson Middle School, and Tourtellotte Memorial High School.
Ownership History
Date
Name
Owned For
Owner Type
Purchase Details
Closed on
Dec 23, 2008
Sold by
Lawton Richard C and Lawton Judith E
Bought by
Travinski Jeremy J and Guillette Robert A
Current Estimated Value
Home Financials for this Owner
Home Financials are based on the most recent Mortgage that was taken out on this home.
Original Mortgage
$187,500
Interest Rate
6.27%
Create a Home Valuation Report for This Property
The Home Valuation Report is an in-depth analysis detailing your home's value as well as a comparison with similar homes in the area
Home Values in the Area
Average Home Value in this Area
Purchase History
| Date | Buyer | Sale Price | Title Company |
|---|---|---|---|
| Travinski Jeremy J | $237,500 | -- | |
| Travinski Jeremy J | $237,500 | -- |
Source: Public Records
Mortgage History
| Date | Status | Borrower | Loan Amount |
|---|---|---|---|
| Open | Travinski Jeremy J | $149,000 | |
| Closed | Travinski Jeremy J | $187,500 | |
| Previous Owner | Travinski Jeremy J | $105,000 |
Source: Public Records
Tax History
| Year | Tax Paid | Tax Assessment Tax Assessment Total Assessment is a certain percentage of the fair market value that is determined by local assessors to be the total taxable value of land and additions on the property. | Land | Improvement |
|---|---|---|---|---|
| 2025 | $4,583 | $241,200 | $53,300 | $187,900 |
| 2024 | $4,790 | $170,400 | $35,000 | $135,400 |
| 2023 | $4,430 | $170,400 | $35,000 | $135,400 |
| 2022 | $4,263 | $170,400 | $35,000 | $135,400 |
| 2021 | $4,251 | $170,400 | $35,000 | $135,400 |
| 2020 | $4,129 | $170,400 | $35,000 | $135,400 |
| 2019 | $3,405 | $122,700 | $36,700 | $86,000 |
| 2018 | $3,405 | $122,700 | $36,700 | $86,000 |
| 2017 | $3,198 | $122,700 | $36,700 | $86,000 |
| 2016 | $3,198 | $122,700 | $36,700 | $86,000 |
| 2015 | $3,043 | $122,700 | $36,700 | $86,000 |
| 2014 | $3,291 | $143,900 | $44,600 | $99,300 |
Source: Public Records
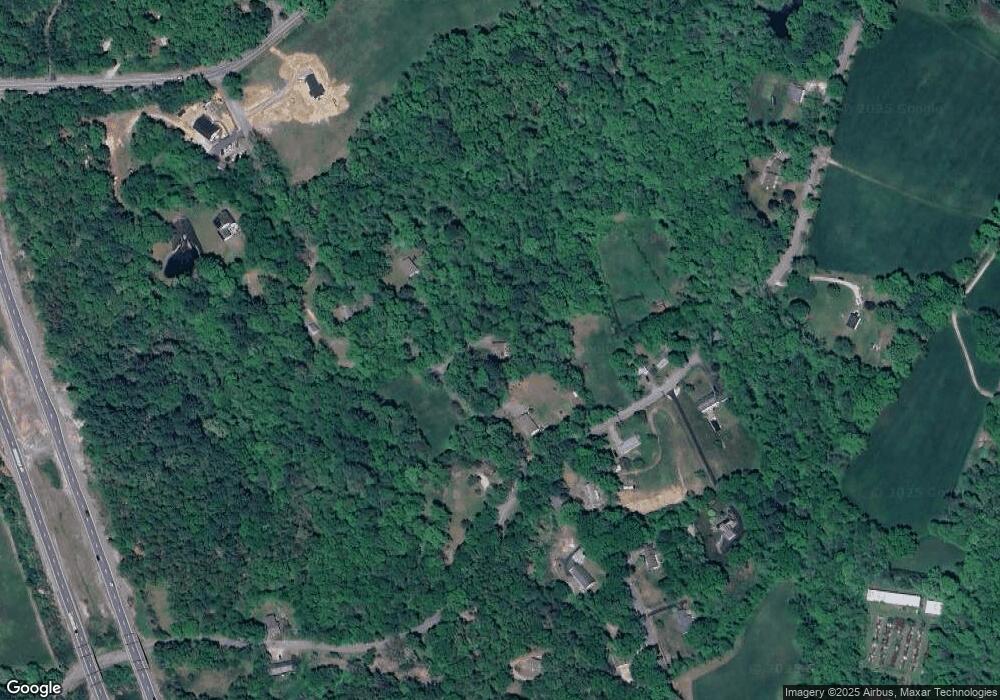
Map
Nearby Homes
- 3 Westside Dr Unit 14
- 99 Azud Rd
- 74 Riverside Dr
- 369 Thompson Rd
- 100 Hawkins Rd
- 115 Groveland Ave
- 115 Groveland Ave Unit 7 & 8
- 129 Mechanics St
- 69 Sunset Hill Rd
- 0 W Thompson Rd Unit 24146108
- 66 Oak Hill Dr
- 55 Mechanics St
- 23 Mechanics St Unit 101
- 0 Church St
- 24 David Cir
- 53 Cleveland St
- 70 Walnut St
- 330 Church St
- 80 Aldrich Rd
- 13 Mohegan St
Your Personal Tour Guide
Ask me questions while you tour the home.