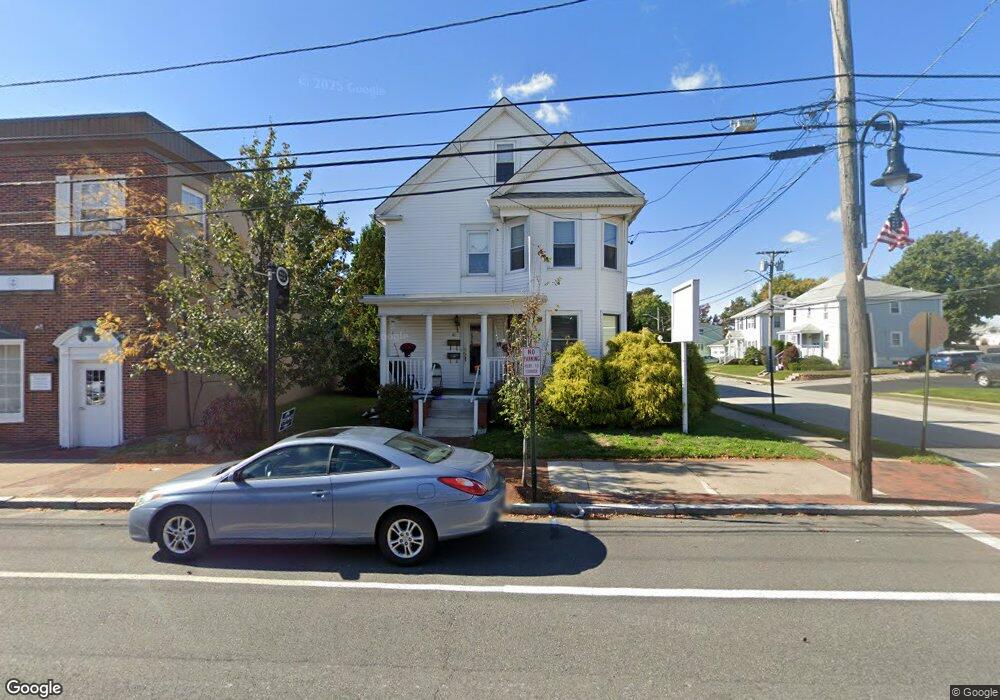
41 Rolfe Square Cranston, RI 02910
Auburn NeighborhoodEstimated Value: $634,179
Studio
--
Bath
3,580
Sq Ft
$177/Sq Ft
Est. Value
About This Home
This home is located at 41 Rolfe Square, Cranston, RI 02910 and is currently estimated at $634,179, approximately $177 per square foot. 41 Rolfe Square is a home located in Providence County with nearby schools including Eden Park Elementary School, Park View Middle School, and Cranston High School East.
Ownership History
Date
Name
Owned For
Owner Type
Purchase Details
Closed on
May 2, 2023
Sold by
James R Decesare Lt and Decesare
Bought by
Rch Holdings Llc
Current Estimated Value
Home Financials for this Owner
Home Financials are based on the most recent Mortgage that was taken out on this home.
Original Mortgage
$420,000
Outstanding Balance
$406,122
Interest Rate
6.42%
Mortgage Type
Purchase Money Mortgage
Estimated Equity
$228,057
Purchase Details
Closed on
Oct 7, 2021
Sold by
Decesare James R
Bought by
James R Decesare Lt and Decesare
Purchase Details
Closed on
Sep 21, 2009
Sold by
Decesare James R
Bought by
Decesare James R
Purchase Details
Closed on
May 30, 2003
Sold by
Daniels Malcolm
Bought by
Rolfe Street Prop Llc
Home Financials for this Owner
Home Financials are based on the most recent Mortgage that was taken out on this home.
Original Mortgage
$192,000
Interest Rate
5.86%
Mortgage Type
Commercial
Create a Home Valuation Report for This Property
The Home Valuation Report is an in-depth analysis detailing your home's value as well as a comparison with similar homes in the area
Home Values in the Area
Average Home Value in this Area
Purchase History
| Date | Buyer | Sale Price | Title Company |
|---|---|---|---|
| Rch Holdings Llc | $500,000 | None Available | |
| James R Decesare Lt | -- | None Available | |
| Decesare James R | $250,000 | -- | |
| Rolfe Street Prop Llc | $242,000 | -- |
Source: Public Records
Mortgage History
| Date | Status | Borrower | Loan Amount |
|---|---|---|---|
| Open | Rch Holdings Llc | $420,000 | |
| Previous Owner | Rolfe Street Prop Llc | $192,000 |
Source: Public Records
Tax History
| Year | Tax Paid | Tax Assessment Tax Assessment Total Assessment is a certain percentage of the fair market value that is determined by local assessors to be the total taxable value of land and additions on the property. | Land | Improvement |
|---|---|---|---|---|
| 2025 | $6,356 | $457,900 | $114,600 | $343,300 |
| 2024 | -- | $457,900 | $114,600 | $343,300 |
| 2023 | $0 | $333,700 | $98,200 | $235,500 |
| 2022 | $0 | $333,700 | $98,200 | $235,500 |
| 2021 | $0 | $333,700 | $98,200 | $235,500 |
| 2020 | $0 | $271,800 | $89,700 | $182,100 |
| 2019 | $0 | $271,800 | $89,700 | $182,100 |
| 2018 | $0 | $271,800 | $89,700 | $182,100 |
| 2017 | $0 | $254,600 | $81,800 | $172,800 |
| 2016 | -- | $254,600 | $81,800 | $172,800 |
| 2015 | -- | $254,600 | $81,800 | $172,800 |
| 2014 | -- | $248,200 | $81,800 | $166,400 |
Source: Public Records
Map
Nearby Homes
- 37 Rolfe Square
- 37 Rolfe Square Unit 1
- 37 Rolfe Square Unit 2
- 249 Auburn St
- 258 Auburn St
- 35 Rolfe Square
- 0 Address Withheld Unit 451776
- 0 Address Withheld Unit 642875
- 0 Address Withheld Unit 16390
- 0 Address Withheld Unit 5929
- 0 Address Withheld Unit 317487
- 0 Address Withheld Unit 651825
- 0 Address Withheld Unit 311272
- 0 Address Withheld Unit 316273
- 0 Address Withheld Unit 205647
- 0 Address Withheld Unit 912621
- 0 Address Withheld Unit 435758
- 0 Address Withheld Unit 814523
- 0 Address Withheld Unit 552519
- 0 Address Withheld Unit 616728
Your Personal Tour Guide
Ask me questions while you tour the home.