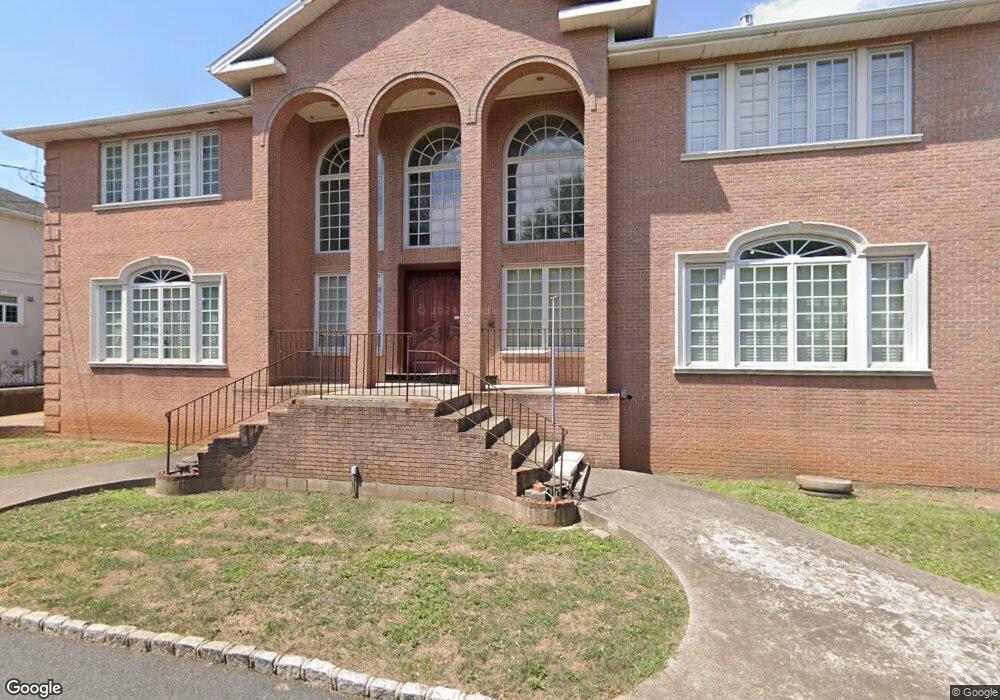
41 Romer Rd Staten Island, NY 10304
Todt Hill NeighborhoodEstimated Value: $1,339,000 - $3,002,000
4
Beds
5
Baths
5,376
Sq Ft
$448/Sq Ft
Est. Value
About This Home
This home is located at 41 Romer Rd, Staten Island, NY 10304 and is currently estimated at $2,410,668, approximately $448 per square foot. 41 Romer Rd is a home located in Richmond County with nearby schools including P.S. 11 Thomas Dongan School, Myra S. Barnes Intermediate School 24, and Susan E Wagner High School.
Ownership History
Date
Name
Owned For
Owner Type
Purchase Details
Closed on
Jul 22, 2025
Sold by
Mazzara Christine
Bought by
Y & T 41 Romer Rd Llc
Current Estimated Value
Purchase Details
Closed on
May 14, 2007
Sold by
Effron Craig
Bought by
Mazzara Christine
Purchase Details
Closed on
Oct 10, 2001
Sold by
Mazzara Frank
Bought by
Effron Craig
Home Financials for this Owner
Home Financials are based on the most recent Mortgage that was taken out on this home.
Original Mortgage
$500,000
Interest Rate
7.18%
Mortgage Type
Purchase Money Mortgage
Purchase Details
Closed on
Jun 6, 1997
Sold by
Blue Star Holding Inc
Bought by
Mazzara Frank
Home Financials for this Owner
Home Financials are based on the most recent Mortgage that was taken out on this home.
Original Mortgage
$320,000
Interest Rate
7.97%
Create a Home Valuation Report for This Property
The Home Valuation Report is an in-depth analysis detailing your home's value as well as a comparison with similar homes in the area
Home Values in the Area
Average Home Value in this Area
Purchase History
| Date | Buyer | Sale Price | Title Company |
|---|---|---|---|
| Y & T 41 Romer Rd Llc | $1,088,000 | Omni Title | |
| Mazzara Christine | -- | Old Republic National Title | |
| Effron Craig | -- | First American Title Ins Co | |
| Mazzara Frank | $482,000 | -- |
Source: Public Records
Mortgage History
| Date | Status | Borrower | Loan Amount |
|---|---|---|---|
| Previous Owner | Effron Craig | $500,000 | |
| Previous Owner | Mazzara Frank | $320,000 |
Source: Public Records
Tax History Compared to Growth
Tax History
| Year | Tax Paid | Tax Assessment Tax Assessment Total Assessment is a certain percentage of the fair market value that is determined by local assessors to be the total taxable value of land and additions on the property. | Land | Improvement |
|---|---|---|---|---|
| 2025 | $26,235 | $135,600 | $30,643 | $104,957 |
| 2024 | $26,235 | $130,620 | $31,574 | $99,046 |
| 2023 | $25,822 | $127,147 | $29,000 | $98,147 |
| 2022 | $23,946 | $126,360 | $30,600 | $95,760 |
| 2021 | $23,815 | $113,160 | $30,600 | $82,560 |
| 2020 | $25,282 | $122,880 | $30,600 | $92,280 |
| 2019 | $23,572 | $112,680 | $30,600 | $82,080 |
| 2018 | $23,325 | $114,420 | $30,600 | $83,820 |
| 2017 | $22,177 | $108,792 | $28,497 | $80,295 |
| 2016 | $21,749 | $108,792 | $27,853 | $80,939 |
| 2015 | $19,123 | $105,626 | $19,151 | $86,475 |
| 2014 | $19,123 | $99,648 | $21,465 | $78,183 |
Source: Public Records
Map
Nearby Homes