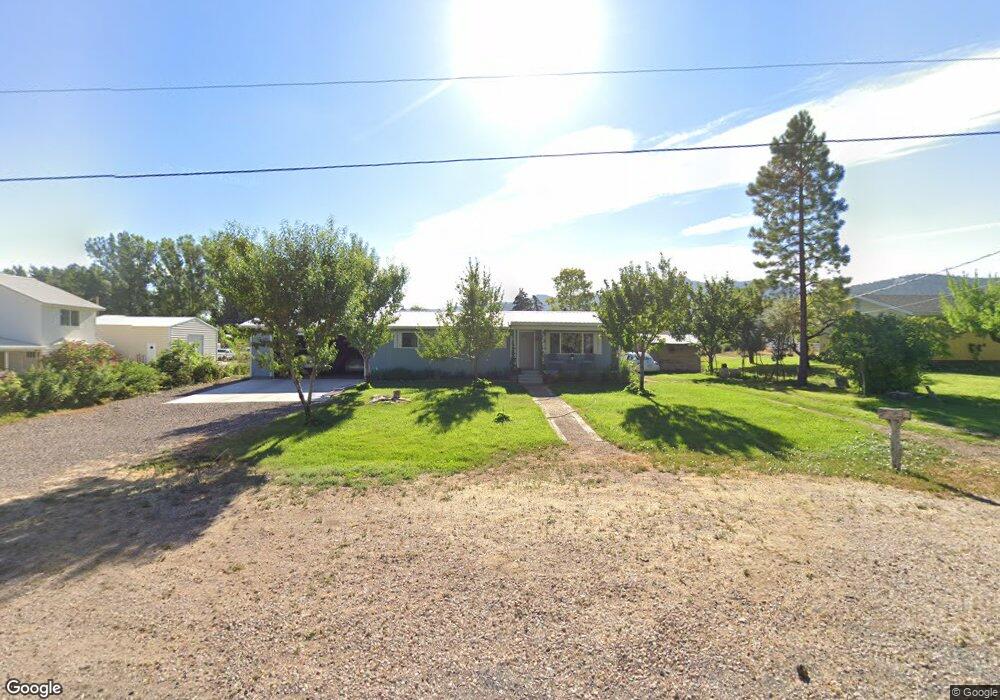
41 S 400 W Parowan, UT 84761
Estimated Value: $388,000 - $489,000
--
Bed
--
Bath
1,040
Sq Ft
$426/Sq Ft
Est. Value
About This Home
This home is located at 41 S 400 W, Parowan, UT 84761 and is currently estimated at $443,109, approximately $426 per square foot. 41 S 400 W is a home with nearby schools including Parowan School, Parowan High School, and Cedar City High School.
Ownership History
Date
Name
Owned For
Owner Type
Purchase Details
Closed on
Jun 3, 2021
Sold by
Page Leland B
Bought by
Leland B Page And Silvia N Page Revocable Liv and Pag Silvia
Current Estimated Value
Purchase Details
Closed on
Dec 15, 2020
Sold by
Page Leland B and Page Silvia N
Bought by
Page Leland B and Page Silvia N
Purchase Details
Closed on
Apr 4, 2006
Sold by
Main Page Ltd
Bought by
Page Leland B and Page Silvia N
Create a Home Valuation Report for This Property
The Home Valuation Report is an in-depth analysis detailing your home's value as well as a comparison with similar homes in the area
Home Values in the Area
Average Home Value in this Area
Purchase History
| Date | Buyer | Sale Price | Title Company |
|---|---|---|---|
| Leland B Page And Silvia N Page Revocable Liv | -- | -- | |
| Page Leland B | -- | Inwest Title | |
| Page Leland B | -- | None Available | |
| Page Leland B | -- | -- |
Source: Public Records
Tax History Compared to Growth
Tax History
| Year | Tax Paid | Tax Assessment Tax Assessment Total Assessment is a certain percentage of the fair market value that is determined by local assessors to be the total taxable value of land and additions on the property. | Land | Improvement |
|---|---|---|---|---|
| 2025 | $2,072 | $257,157 | $63,796 | $193,361 |
| 2023 | $1,865 | $140,870 | $56,960 | $83,910 |
| 2022 | $1,114 | $116,325 | $51,780 | $64,545 |
| 2021 | $928 | $96,910 | $32,365 | $64,545 |
| 2020 | $929 | $85,690 | $25,395 | $60,295 |
| 2019 | $935 | $82,280 | $25,395 | $56,885 |
| 2018 | $917 | $78,970 | $22,085 | $56,885 |
| 2017 | $852 | $71,575 | $22,085 | $49,490 |
| 2016 | $883 | $70,320 | $22,085 | $48,235 |
| 2015 | $866 | $65,125 | $0 | $0 |
| 2014 | $922 | $66,120 | $0 | $0 |
Source: Public Records
Map
Nearby Homes