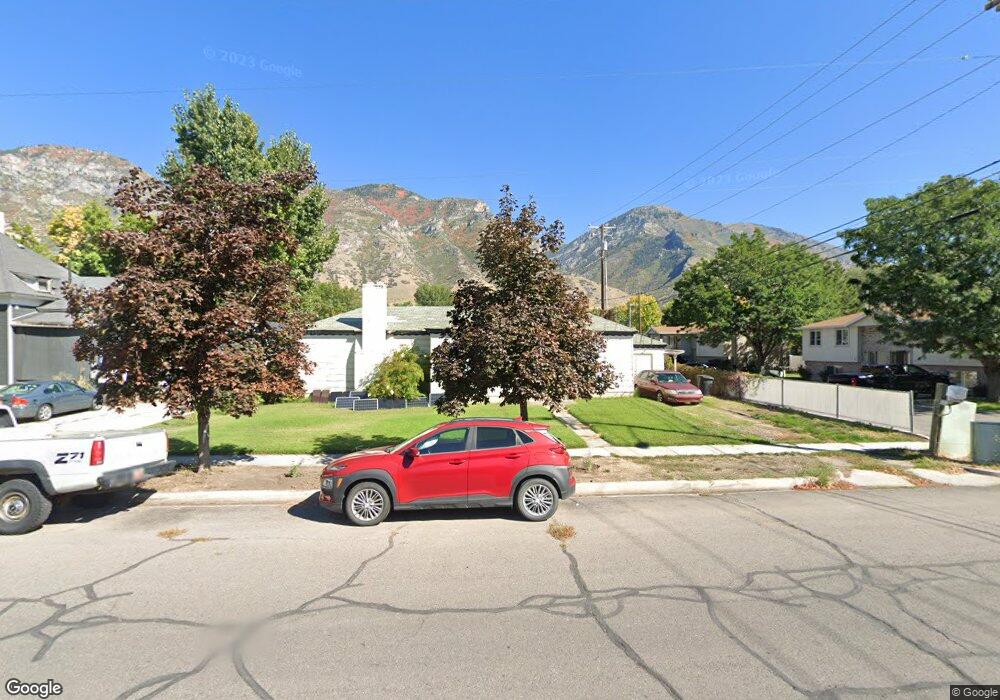
41 S 600 E Provo, UT 84606
Joaquin NeighborhoodEstimated Value: $441,927 - $558,000
2
Beds
2
Baths
1,219
Sq Ft
$419/Sq Ft
Est. Value
About This Home
This home is located at 41 S 600 E, Provo, UT 84606 and is currently estimated at $511,309, approximately $419 per square foot. 41 S 600 E is a home located in Utah County with nearby schools including Provo Peaks School, Centennial Middle School, and Timpview High School.
Ownership History
Date
Name
Owned For
Owner Type
Purchase Details
Closed on
Aug 5, 2020
Sold by
Isaacson Terry B
Bought by
Isaacson Sharon
Current Estimated Value
Purchase Details
Closed on
Mar 18, 1997
Sold by
Isaacson Terry and Isaacson Sharon
Bought by
Isaacson Terry B and Isaacson Sharon
Home Financials for this Owner
Home Financials are based on the most recent Mortgage that was taken out on this home.
Original Mortgage
$86,500
Interest Rate
7.86%
Create a Home Valuation Report for This Property
The Home Valuation Report is an in-depth analysis detailing your home's value as well as a comparison with similar homes in the area
Home Values in the Area
Average Home Value in this Area
Purchase History
| Date | Buyer | Sale Price | Title Company |
|---|---|---|---|
| Isaacson Sharon | -- | None Available | |
| Isaacson Terry B | -- | -- |
Source: Public Records
Mortgage History
| Date | Status | Borrower | Loan Amount |
|---|---|---|---|
| Closed | Isaacson Terry B | $86,500 |
Source: Public Records
Tax History
| Year | Tax Paid | Tax Assessment Tax Assessment Total Assessment is a certain percentage of the fair market value that is determined by local assessors to be the total taxable value of land and additions on the property. | Land | Improvement |
|---|---|---|---|---|
| 2025 | $2,200 | $237,105 | -- | -- |
| 2024 | $2,200 | $216,535 | $0 | $0 |
| 2023 | $2,159 | $209,550 | $0 | $0 |
| 2022 | $2,404 | $235,180 | $0 | $0 |
| 2021 | $1,800 | $307,200 | $114,200 | $193,000 |
| 2020 | $1,736 | $277,700 | $103,800 | $173,900 |
| 2019 | $1,636 | $272,200 | $103,800 | $168,400 |
| 2018 | $1,444 | $243,700 | $97,300 | $146,400 |
| 2017 | $1,333 | $123,585 | $0 | $0 |
| 2016 | $1,215 | $104,995 | $0 | $0 |
| 2015 | $1,145 | $99,990 | $0 | $0 |
| 2014 | $968 | $88,165 | $0 | $0 |
Source: Public Records
Map
Nearby Homes
Your Personal Tour Guide
Ask me questions while you tour the home.