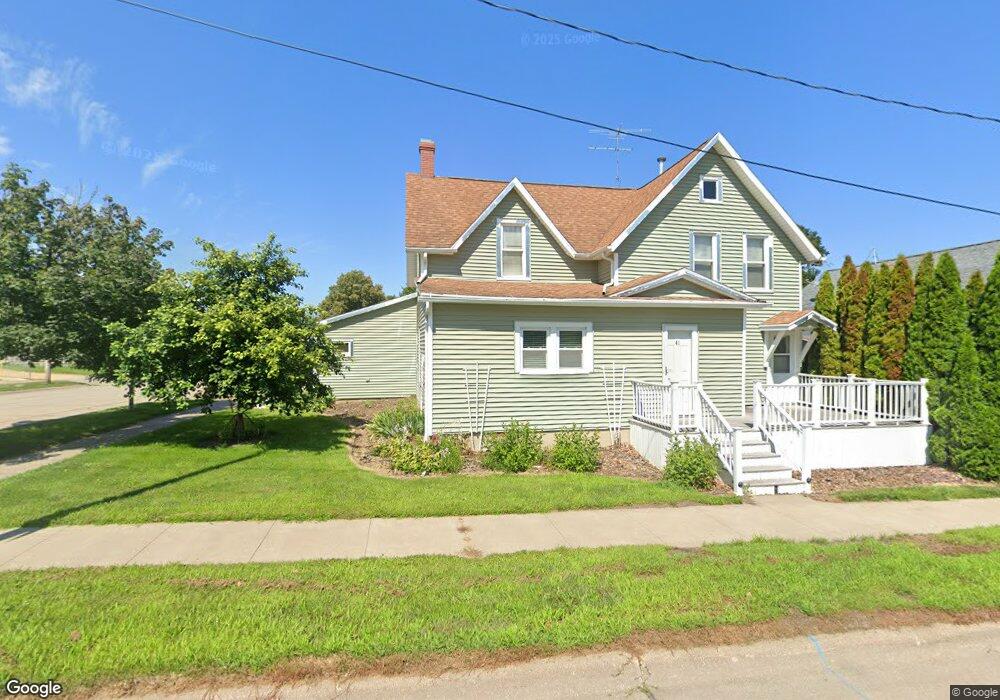
41 S Mitchell St Preston, IA 52069
Estimated Value: $172,000 - $215,000
4
Beds
4
Baths
2,348
Sq Ft
$83/Sq Ft
Est. Value
About This Home
This home is located at 41 S Mitchell St, Preston, IA 52069 and is currently estimated at $193,809, approximately $82 per square foot. 41 S Mitchell St is a home located in Jackson County.
Ownership History
Date
Name
Owned For
Owner Type
Purchase Details
Closed on
Sep 1, 2020
Sold by
Jensen Jeffrey D and Jensen Billie J
Bought by
Gerlach Jacob J
Current Estimated Value
Home Financials for this Owner
Home Financials are based on the most recent Mortgage that was taken out on this home.
Original Mortgage
$140,000
Outstanding Balance
$123,724
Interest Rate
2.8%
Mortgage Type
New Conventional
Estimated Equity
$70,085
Purchase Details
Closed on
Sep 18, 2006
Sold by
Concept Living Real Estate Llc
Bought by
Jensen Jeffrey D
Home Financials for this Owner
Home Financials are based on the most recent Mortgage that was taken out on this home.
Original Mortgage
$83,341
Interest Rate
6.7%
Mortgage Type
FHA
Create a Home Valuation Report for This Property
The Home Valuation Report is an in-depth analysis detailing your home's value as well as a comparison with similar homes in the area
Home Values in the Area
Average Home Value in this Area
Purchase History
| Date | Buyer | Sale Price | Title Company |
|---|---|---|---|
| Gerlach Jacob J | $140,000 | None Available | |
| Jensen Jeffrey D | $84,000 | None Available |
Source: Public Records
Mortgage History
| Date | Status | Borrower | Loan Amount |
|---|---|---|---|
| Open | Gerlach Jacob J | $140,000 | |
| Previous Owner | Jensen Jeffrey D | $83,341 |
Source: Public Records
Tax History Compared to Growth
Tax History
| Year | Tax Paid | Tax Assessment Tax Assessment Total Assessment is a certain percentage of the fair market value that is determined by local assessors to be the total taxable value of land and additions on the property. | Land | Improvement |
|---|---|---|---|---|
| 2025 | $2,482 | $186,700 | $12,000 | $174,700 |
| 2024 | $2,482 | $162,500 | $12,000 | $150,500 |
| 2023 | $2,440 | $162,500 | $12,000 | $150,500 |
| 2022 | $2,174 | $139,100 | $12,000 | $127,100 |
| 2021 | $1,906 | $130,900 | $12,000 | $118,900 |
| 2020 | $1,906 | $111,800 | $12,000 | $99,800 |
| 2019 | $1,738 | $105,600 | $0 | $0 |
| 2018 | $1,540 | $105,600 | $0 | $0 |
| 2017 | $1,540 | $98,800 | $0 | $0 |
| 2016 | $1,586 | $98,800 | $0 | $0 |
| 2015 | $1,586 | $98,800 | $0 | $0 |
| 2014 | $1,556 | $98,800 | $0 | $0 |
Source: Public Records
Map
Nearby Homes