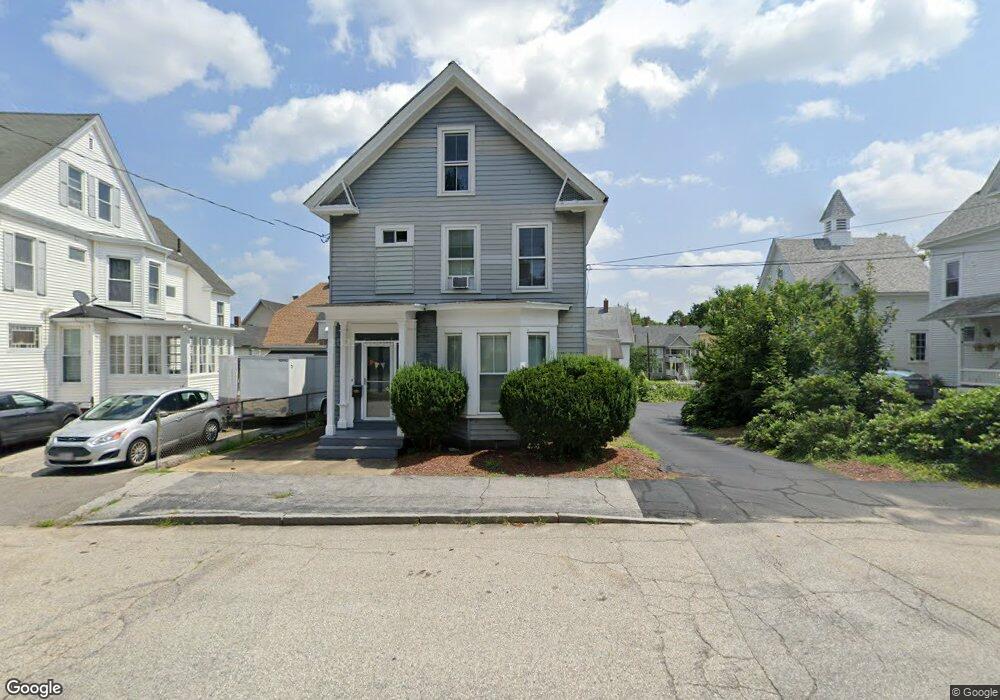
41 S Spring St Concord, NH 03301
South End NeighborhoodEstimated Value: $437,343 - $529,000
4
Beds
2
Baths
2,462
Sq Ft
$194/Sq Ft
Est. Value
About This Home
This home is located at 41 S Spring St, Concord, NH 03301 and is currently estimated at $478,586, approximately $194 per square foot. 41 S Spring St is a home located in Merrimack County with nearby schools including Christa McAuliffe School, Rundlett Middle School, and Concord High School.
Ownership History
Date
Name
Owned For
Owner Type
Purchase Details
Closed on
Oct 12, 2023
Sold by
Fortier Hermel D
Bought by
Fortier Dave G
Current Estimated Value
Home Financials for this Owner
Home Financials are based on the most recent Mortgage that was taken out on this home.
Original Mortgage
$127,000
Outstanding Balance
$124,066
Interest Rate
7.18%
Mortgage Type
Stand Alone Refi Refinance Of Original Loan
Estimated Equity
$354,520
Purchase Details
Closed on
Dec 22, 2008
Sold by
Fnma
Bought by
Fortier Dave G and Fortier Hermel D
Home Financials for this Owner
Home Financials are based on the most recent Mortgage that was taken out on this home.
Original Mortgage
$143,910
Interest Rate
6.27%
Mortgage Type
Purchase Money Mortgage
Purchase Details
Closed on
May 13, 2008
Sold by
Blake Song Cha and Fnma
Bought by
Federal National Mortgage Association
Create a Home Valuation Report for This Property
The Home Valuation Report is an in-depth analysis detailing your home's value as well as a comparison with similar homes in the area
Home Values in the Area
Average Home Value in this Area
Purchase History
| Date | Buyer | Sale Price | Title Company |
|---|---|---|---|
| Fortier Dave G | -- | None Available | |
| Fortier Dave G | -- | None Available | |
| Fortier Dave G | $92,300 | -- | |
| Federal National Mortgage Association | $166,200 | -- | |
| Fortier Dave G | $92,300 | -- | |
| Federal National Mortgage Association | $166,200 | -- |
Source: Public Records
Mortgage History
| Date | Status | Borrower | Loan Amount |
|---|---|---|---|
| Open | Fortier Dave G | $127,000 | |
| Closed | Fortier Dave G | $127,000 | |
| Previous Owner | Federal National Mortgage Association | $175,500 | |
| Previous Owner | Federal National Mortgage Association | $143,910 |
Source: Public Records
Tax History
| Year | Tax Paid | Tax Assessment Tax Assessment Total Assessment is a certain percentage of the fair market value that is determined by local assessors to be the total taxable value of land and additions on the property. | Land | Improvement |
|---|---|---|---|---|
| 2025 | $8,270 | $284,100 | $89,700 | $194,400 |
| 2024 | $7,806 | $281,900 | $89,700 | $192,200 |
| 2023 | $7,572 | $281,900 | $89,700 | $192,200 |
| 2022 | $7,298 | $281,900 | $89,700 | $192,200 |
| 2021 | $7,132 | $283,900 | $89,700 | $194,200 |
| 2020 | $6,599 | $246,600 | $71,600 | $175,000 |
| 2019 | $6,356 | $228,800 | $66,500 | $162,300 |
| 2018 | $6,030 | $213,900 | $66,500 | $147,400 |
| 2017 | $5,699 | $201,800 | $66,500 | $135,300 |
| 2016 | $5,426 | $196,100 | $66,500 | $129,600 |
| 2015 | $5,044 | $186,600 | $65,100 | $121,500 |
| 2014 | $5,003 | $186,600 | $65,100 | $121,500 |
| 2013 | -- | $185,300 | $65,100 | $120,200 |
| 2012 | -- | $184,700 | $65,100 | $119,600 |
Source: Public Records
Map
Nearby Homes
- 47 South St
- 4 N Spring St
- 0 Spruce St Unit 88
- 20 Carter St
- 105 S Main St
- 1 Matthew St Unit 6
- 0 South St Unit 4969509
- 1 Kensington Rd
- 11 Washington St
- 55 Tremont St
- 5 Broad Ave
- 157 Rumford St
- 28 Stevens Dr
- 7 Highridge Trail
- 24 Hazel Dr
- 22 Fairfield Dr
- 22 Longmeadow Dr
- 15 Bridle Path Trail
- 5 Ormond St
- 6 Grover St
- 73 Concord St
- 39 S Spring St
- 43 S Spring St
- 43 S Spring St Unit 1
- 44 South St
- 40 South St Unit 42
- 46 South St
- 114 St
- 38 South St
- 26 S Spring St
- 37 S Spring St
- 48 South St Unit 2
- 48 South St
- 48 South St Unit 1
- 26 N Spring St
- 60 Concord St
- 47 S Spring St
- 34 South St
- 35 S Spring St
- 35 S Spring St Unit 2