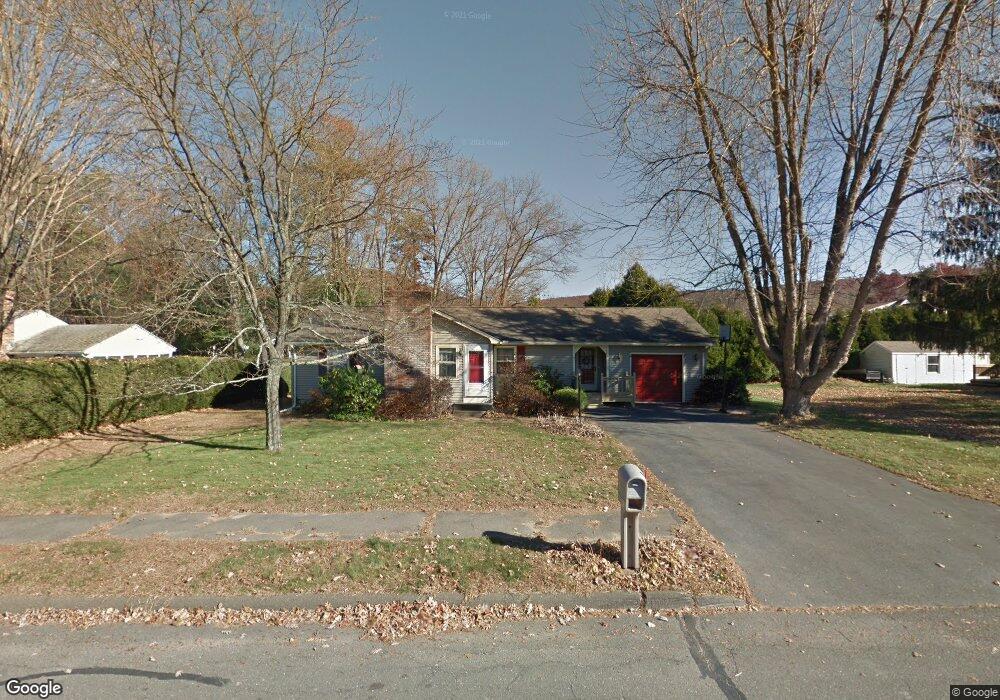
41 Sandra Rd Easthampton, MA 01027
Estimated Value: $420,000 - $491,000
3
Beds
2
Baths
1,330
Sq Ft
$337/Sq Ft
Est. Value
About This Home
This home is located at 41 Sandra Rd, Easthampton, MA 01027 and is currently estimated at $447,845, approximately $336 per square foot. 41 Sandra Rd is a home located in Hampshire County with nearby schools including Easthampton High School, Calvary Baptist Christian School, and Tri-County Schools.
Ownership History
Date
Name
Owned For
Owner Type
Purchase Details
Closed on
Nov 1, 2004
Sold by
Parent Maryann C and Parent Roger C
Bought by
Rogers Ernest J and Rogers Margaret R
Current Estimated Value
Purchase Details
Closed on
Jun 10, 1988
Sold by
Hopwood Barbara A
Bought by
Parent Maryann C
Create a Home Valuation Report for This Property
The Home Valuation Report is an in-depth analysis detailing your home's value as well as a comparison with similar homes in the area
Home Values in the Area
Average Home Value in this Area
Purchase History
| Date | Buyer | Sale Price | Title Company |
|---|---|---|---|
| Rogers Ernest J | $232,000 | -- | |
| Parent Maryann C | $114,000 | -- |
Source: Public Records
Mortgage History
| Date | Status | Borrower | Loan Amount |
|---|---|---|---|
| Previous Owner | Parent Maryann C | $143,000 | |
| Previous Owner | Parent Maryann C | $16,000 | |
| Previous Owner | Parent Maryann C | $8,000 | |
| Previous Owner | Parent Maryann C | $88,000 |
Source: Public Records
Tax History
| Year | Tax Paid | Tax Assessment Tax Assessment Total Assessment is a certain percentage of the fair market value that is determined by local assessors to be the total taxable value of land and additions on the property. | Land | Improvement |
|---|---|---|---|---|
| 2025 | $5,531 | $404,600 | $118,700 | $285,900 |
| 2024 | $5,340 | $393,800 | $115,200 | $278,600 |
| 2023 | $4,169 | $284,600 | $90,600 | $194,000 |
| 2022 | $4,704 | $284,600 | $90,600 | $194,000 |
| 2021 | $5,162 | $294,300 | $90,600 | $203,700 |
| 2020 | $5,054 | $284,600 | $90,600 | $194,000 |
| 2019 | $4,219 | $272,900 | $90,600 | $182,300 |
| 2018 | $4,038 | $252,400 | $85,600 | $166,800 |
| 2017 | $3,944 | $243,300 | $82,300 | $161,000 |
| 2016 | $3,793 | $243,300 | $82,300 | $161,000 |
| 2015 | $3,686 | $243,300 | $82,300 | $161,000 |
Source: Public Records
Map
Nearby Homes
Your Personal Tour Guide
Ask me questions while you tour the home.