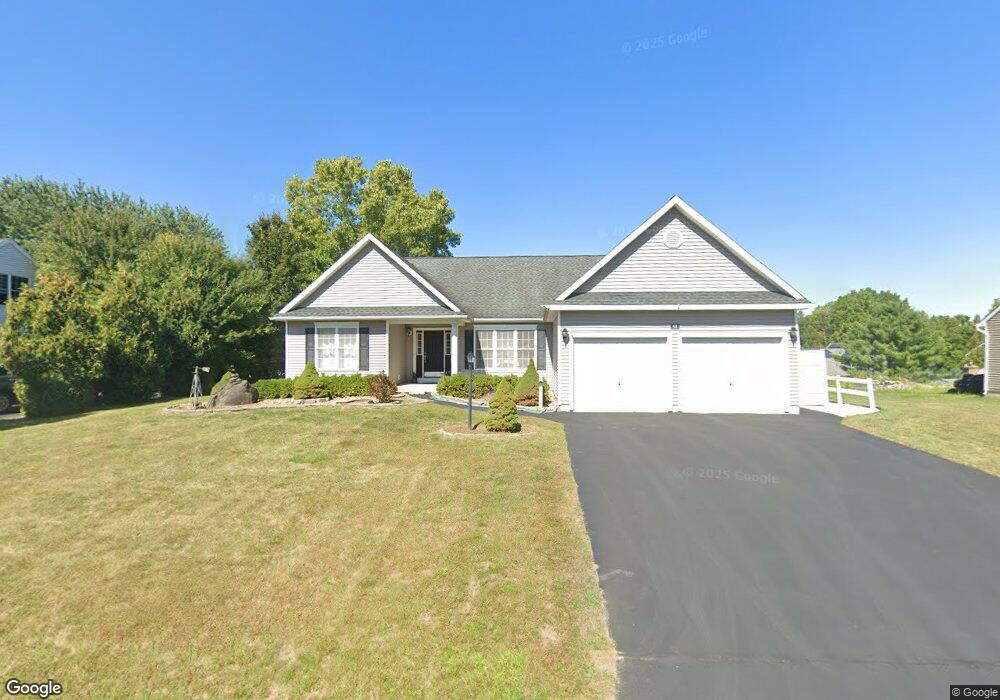
41 Sandy Ln Selkirk, NY 12158
Estimated Value: $438,598 - $470,000
3
Beds
2
Baths
1,800
Sq Ft
$252/Sq Ft
Est. Value
About This Home
This home is located at 41 Sandy Ln, Selkirk, NY 12158 and is currently estimated at $453,400, approximately $251 per square foot. 41 Sandy Ln is a home located in Albany County with nearby schools including Albertus W Becker School, Ravena-Coeymans-Selkirk Middle School, and Ravena-Coeymans-Selkirk Senior High School.
Ownership History
Date
Name
Owned For
Owner Type
Purchase Details
Closed on
Apr 9, 2009
Sold by
Rosewood Home Builders Llc
Bought by
Haskins Philip J and Haskins Janine L
Current Estimated Value
Home Financials for this Owner
Home Financials are based on the most recent Mortgage that was taken out on this home.
Original Mortgage
$233,228
Outstanding Balance
$147,438
Interest Rate
4.94%
Mortgage Type
Purchase Money Mortgage
Estimated Equity
$305,963
Create a Home Valuation Report for This Property
The Home Valuation Report is an in-depth analysis detailing your home's value as well as a comparison with similar homes in the area
Home Values in the Area
Average Home Value in this Area
Purchase History
| Date | Buyer | Sale Price | Title Company |
|---|---|---|---|
| Haskins Philip J | $264,000 | None Available |
Source: Public Records
Mortgage History
| Date | Status | Borrower | Loan Amount |
|---|---|---|---|
| Open | Haskins Philip J | $233,228 |
Source: Public Records
Tax History
| Year | Tax Paid | Tax Assessment Tax Assessment Total Assessment is a certain percentage of the fair market value that is determined by local assessors to be the total taxable value of land and additions on the property. | Land | Improvement |
|---|---|---|---|---|
| 2024 | $8,115 | $278,000 | $64,500 | $213,500 |
| 2023 | $7,800 | $278,000 | $64,500 | $213,500 |
| 2022 | $2,605 | $278,000 | $64,500 | $213,500 |
| 2021 | $2,605 | $278,000 | $64,500 | $213,500 |
| 2020 | $2,550 | $278,000 | $64,500 | $213,500 |
| 2019 | $7,489 | $278,000 | $64,500 | $213,500 |
| 2018 | $2,533 | $278,000 | $64,500 | $213,500 |
| 2017 | $7,184 | $278,000 | $64,500 | $213,500 |
| 2016 | $4,862 | $278,000 | $64,500 | $213,500 |
| 2015 | -- | $278,000 | $64,500 | $213,500 |
| 2014 | -- | $278,000 | $64,500 | $213,500 |
Source: Public Records
Map
Nearby Homes
Your Personal Tour Guide
Ask me questions while you tour the home.