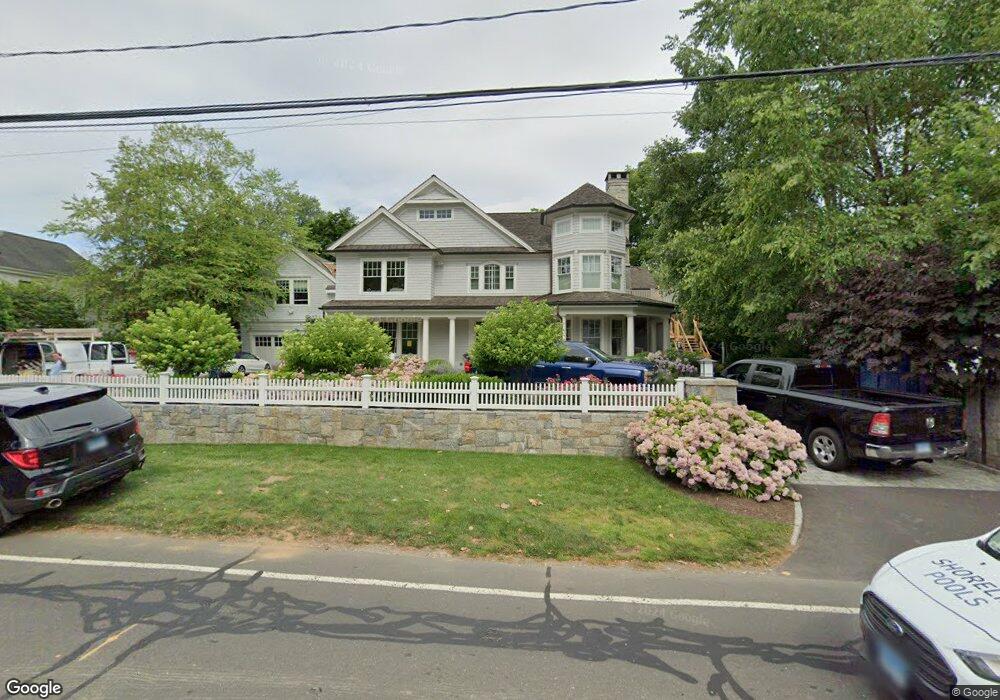
41 Shore Rd Old Greenwich, CT 06870
Old Greenwich NeighborhoodEstimated Value: $5,285,000 - $6,224,779
5
Beds
7
Baths
6,028
Sq Ft
$973/Sq Ft
Est. Value
About This Home
This home is located at 41 Shore Rd, Old Greenwich, CT 06870 and is currently estimated at $5,865,926, approximately $973 per square foot. 41 Shore Rd is a home located in Fairfield County with nearby schools including Old Greenwich School, Eastern Middle School, and Greenwich High School.
Ownership History
Date
Name
Owned For
Owner Type
Purchase Details
Closed on
Sep 15, 2009
Sold by
Lawton Jennifer J
Bought by
Rosen Josh and Rosen Yael
Current Estimated Value
Purchase Details
Closed on
May 22, 2000
Sold by
Maloney Thomas J and Maloney Nancy N
Bought by
Lawton Thoms J and Lawton Jennifer J
Create a Home Valuation Report for This Property
The Home Valuation Report is an in-depth analysis detailing your home's value as well as a comparison with similar homes in the area
Home Values in the Area
Average Home Value in this Area
Purchase History
| Date | Buyer | Sale Price | Title Company |
|---|---|---|---|
| Rosen Josh | $1,500,000 | -- | |
| Lawton Thoms J | $1,295,000 | -- |
Source: Public Records
Mortgage History
| Date | Status | Borrower | Loan Amount |
|---|---|---|---|
| Open | Lawton Thoms J | $1,500,000 | |
| Closed | Lawton Thoms J | $1,250,000 |
Source: Public Records
Tax History Compared to Growth
Tax History
| Year | Tax Paid | Tax Assessment Tax Assessment Total Assessment is a certain percentage of the fair market value that is determined by local assessors to be the total taxable value of land and additions on the property. | Land | Improvement |
|---|---|---|---|---|
| 2025 | $37,333 | $3,020,710 | $1,151,150 | $1,869,560 |
| 2024 | $35,977 | $3,014,200 | $1,151,150 | $1,863,050 |
| 2023 | $35,073 | $3,014,200 | $1,151,150 | $1,863,050 |
| 2022 | $34,565 | $2,997,820 | $1,151,150 | $1,846,670 |
| 2021 | $35,938 | $2,984,870 | $1,022,350 | $1,962,520 |
| 2020 | $35,878 | $2,984,870 | $1,022,350 | $1,962,520 |
| 2019 | $36,236 | $2,984,870 | $1,022,350 | $1,962,520 |
| 2018 | $36,923 | $2,984,870 | $1,022,350 | $1,962,520 |
| 2017 | $35,875 | $2,984,870 | $1,022,350 | $1,962,520 |
| 2016 | $35,308 | $2,984,870 | $1,022,350 | $1,962,520 |
| 2015 | $32,458 | $2,721,810 | $1,117,620 | $1,604,190 |
| 2014 | $31,129 | $2,677,780 | $1,117,620 | $1,560,160 |
Source: Public Records
Map
Nearby Homes
- 45 Binney Ln
- 54 Signal Rd
- 50 Signal Rd
- 46 Signal Rd
- 42 Signal Rd
- 348 Sound Beach Ave
- 137 Shore Rd
- 602 Fairfield Ave
- 145 Shore Rd
- 8 Quintard Ave
- 11 Shorelands Place
- 7 Highview Ave
- 8 Park Ave
- 20 Cook Rd
- 34 Davenport Dr
- 51 Forest Ave Unit 98
- 200 Shore Rd
- 98 Southfield Ave Unit 101
- 209 Shore Rd
- 10 W Crossway