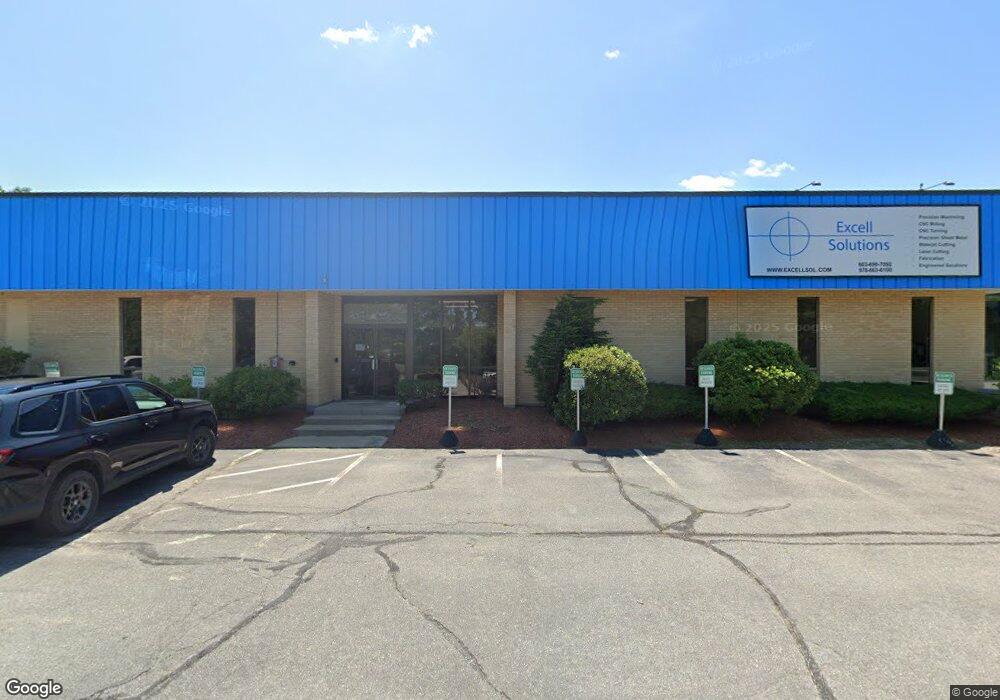
41 Simon St Nashua, NH 03060
Mine Falls Park NeighborhoodEstimated Value: $7,899,129
--
Bed
--
Bath
54,053
Sq Ft
$146/Sq Ft
Est. Value
About This Home
This home is located at 41 Simon St, Nashua, NH 03060 and is currently estimated at $7,899,129, approximately $146 per square foot. 41 Simon St is a home located in Hillsborough County with nearby schools including Ledge Street Elementary School, Fairgrounds Middle School, and Nashua High School South.
Ownership History
Date
Name
Owned For
Owner Type
Purchase Details
Closed on
Dec 22, 2021
Sold by
Tanguay Avenue Llc
Bought by
Loon Island Realty Llc
Current Estimated Value
Home Financials for this Owner
Home Financials are based on the most recent Mortgage that was taken out on this home.
Original Mortgage
$4,800,000
Outstanding Balance
$4,388,495
Interest Rate
2.98%
Mortgage Type
Purchase Money Mortgage
Estimated Equity
$3,510,634
Purchase Details
Closed on
Jan 23, 2004
Sold by
Sanmina Sci Corp
Bought by
Tanguay Ave Llc
Home Financials for this Owner
Home Financials are based on the most recent Mortgage that was taken out on this home.
Original Mortgage
$1,845,000
Interest Rate
5.89%
Mortgage Type
Commercial
Create a Home Valuation Report for This Property
The Home Valuation Report is an in-depth analysis detailing your home's value as well as a comparison with similar homes in the area
Home Values in the Area
Average Home Value in this Area
Purchase History
| Date | Buyer | Sale Price | Title Company |
|---|---|---|---|
| Loon Island Realty Llc | $6,000,000 | None Available | |
| Tanguay Ave Llc | $1,850,000 | -- |
Source: Public Records
Mortgage History
| Date | Status | Borrower | Loan Amount |
|---|---|---|---|
| Open | Loon Island Realty Llc | $4,800,000 | |
| Previous Owner | Tanguay Ave Llc | $1,875,000 | |
| Previous Owner | Tanguay Ave Llc | $858,431 | |
| Previous Owner | Tanguay Ave Llc | $1,845,000 |
Source: Public Records
Tax History Compared to Growth
Tax History
| Year | Tax Paid | Tax Assessment Tax Assessment Total Assessment is a certain percentage of the fair market value that is determined by local assessors to be the total taxable value of land and additions on the property. | Land | Improvement |
|---|---|---|---|---|
| 2024 | $90,869 | $5,715,000 | $668,600 | $5,046,400 |
| 2023 | $99,651 | $5,466,300 | $579,600 | $4,886,700 |
| 2022 | $98,776 | $5,466,300 | $579,600 | $4,886,700 |
| 2021 | $65,490 | $2,820,400 | $513,900 | $2,306,500 |
| 2020 | $63,769 | $2,820,400 | $513,900 | $2,306,500 |
| 2019 | $61,372 | $2,820,400 | $513,900 | $2,306,500 |
| 2018 | $59,821 | $2,820,400 | $513,900 | $2,306,500 |
| 2017 | $54,291 | $2,105,100 | $412,300 | $1,692,800 |
| 2016 | $52,775 | $2,105,100 | $412,300 | $1,692,800 |
| 2015 | $51,638 | $2,105,100 | $412,300 | $1,692,800 |
| 2014 | $50,628 | $2,105,100 | $412,300 | $1,692,800 |
Source: Public Records
Map
Nearby Homes
- 32-34 Grand Ave
- 22 New Dunstable Rd Unit 132133
- 41 New Dunstable Rd Unit 371
- 169A W Hollis St Unit 193
- 7 Bitirnas St Unit U7
- 4 Badger St
- 22 Kern Dr
- 30 Ledge St
- 11 Bordeaux St
- 6 Lake Ave
- 22 Wilder St
- 38 Central St
- 29 Wilder St
- 0 Baldwin St
- 239 Broad St
- 247 Main Dunstable Rd
- 11 Amherst Terrace
- 22 Berkshire Rd
- 121 Palm St
- 8 Buck St Unit 10