Estimated Value: $1,399,000 - $1,631,000
4
Beds
2
Baths
2,136
Sq Ft
$718/Sq Ft
Est. Value
About This Home
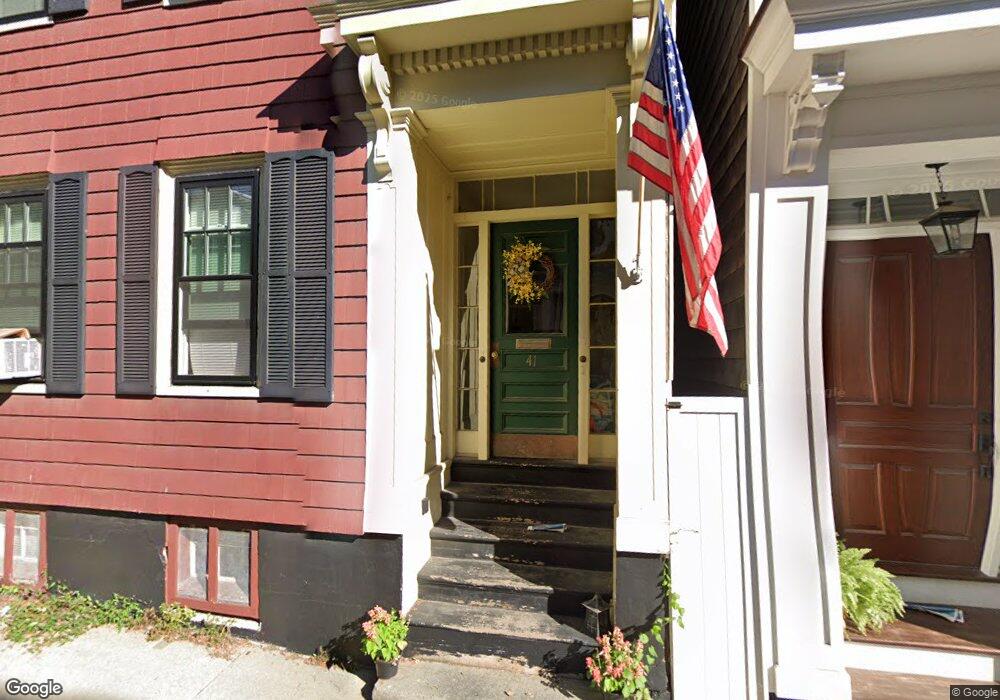
This home is located at 41 Soley St, Charlestown, MA 02129 and is currently estimated at $1,532,617, approximately $717 per square foot. 41 Soley St is a home located in Suffolk County with nearby schools including Boston Children's School and St John School.
Ownership History
Date
Name
Owned For
Owner Type
Purchase Details
Closed on
Nov 3, 2000
Sold by
Spinetto Stephen M
Bought by
Stolberg Penny D and Dickson Jeffrey L
Current Estimated Value
Purchase Details
Closed on
Jan 31, 1992
Sold by
Abbott Gerard J Est
Bought by
Brady Annmarie and Brady Patrick M
Create a Home Valuation Report for This Property
The Home Valuation Report is an in-depth analysis detailing your home's value as well as a comparison with similar homes in the area
Home Values in the Area
Average Home Value in this Area
Purchase History
| Date | Buyer | Sale Price | Title Company |
|---|---|---|---|
| Stolberg Penny D | $67,900 | -- | |
| Brady Annmarie | $170,000 | -- | |
| Brady Annmarie | $170,000 | -- |
Source: Public Records
Mortgage History
| Date | Status | Borrower | Loan Amount |
|---|---|---|---|
| Open | Brady Annmarie | $209,030 | |
| Closed | Brady Annmarie | $150,000 | |
| Closed | Brady Annmarie | $237,000 |
Source: Public Records
Tax History Compared to Growth
Tax History
| Year | Tax Paid | Tax Assessment Tax Assessment Total Assessment is a certain percentage of the fair market value that is determined by local assessors to be the total taxable value of land and additions on the property. | Land | Improvement |
|---|---|---|---|---|
| 2025 | $13,653 | $1,179,000 | $485,500 | $693,500 |
| 2024 | $13,118 | $1,203,500 | $489,100 | $714,400 |
| 2023 | $12,926 | $1,203,500 | $489,100 | $714,400 |
| 2022 | $12,713 | $1,168,500 | $474,900 | $693,600 |
| 2021 | $12,468 | $1,168,500 | $474,900 | $693,600 |
| 2020 | $11,923 | $1,129,100 | $446,500 | $682,600 |
| 2019 | $10,821 | $1,026,700 | $337,500 | $689,200 |
| 2018 | $10,053 | $959,300 | $337,500 | $621,800 |
| 2017 | $9,671 | $913,200 | $337,500 | $575,700 |
| 2016 | $9,389 | $853,500 | $337,500 | $516,000 |
| 2015 | $8,515 | $703,100 | $331,400 | $371,700 |
| 2014 | $7,956 | $632,400 | $331,400 | $301,000 |
Source: Public Records
Map
Nearby Homes
- 5 Wallace Ct
- 17 Henley St Unit F
- 17 Henley St Unit B
- 46 High St
- 12 Prospect St Unit 2
- 12 Prospect St Unit 1
- 73 Chelsea St Unit 401
- 56 High St Unit 3
- 22 Harvard St
- 106 Bunker Hill St Unit 2
- 106 Bunker Hill St Unit 6
- 106 Bunker Hill St Unit 1
- 106 Bunker Hill St Unit 4P
- 106 Bunker Hill St Unit 3
- 1 Washington Place
- 172 Bunker Hill St Unit 1
- 207 Bunker Hill St Unit 2
- 9 Russell St Unit 2
- 9 Russell St Unit 1
- 247 Bunker Hill St Unit A
- 21 Monument Ct Unit 1
- 39 Soley St Unit 2
- 39 Soley St
- 43 Soley St Unit 3
- 43 Soley St Unit 2
- 43 Soley St Unit 1
- 45 Soley St
- 45 Soley St Unit 1
- 28 Monument Ct
- 35 Soley St
- 35 Soley St Unit 1
- 47 Soley St Unit 2
- 47 Soley St
- 47 Soley St Unit 1
- 47 Soley St Unit 3
- 33 Soley St Unit 2
- 33 Soley St Unit 1
- 34 Soley St Unit 2
- 34 Soley St Unit 1
- 36 Soley St