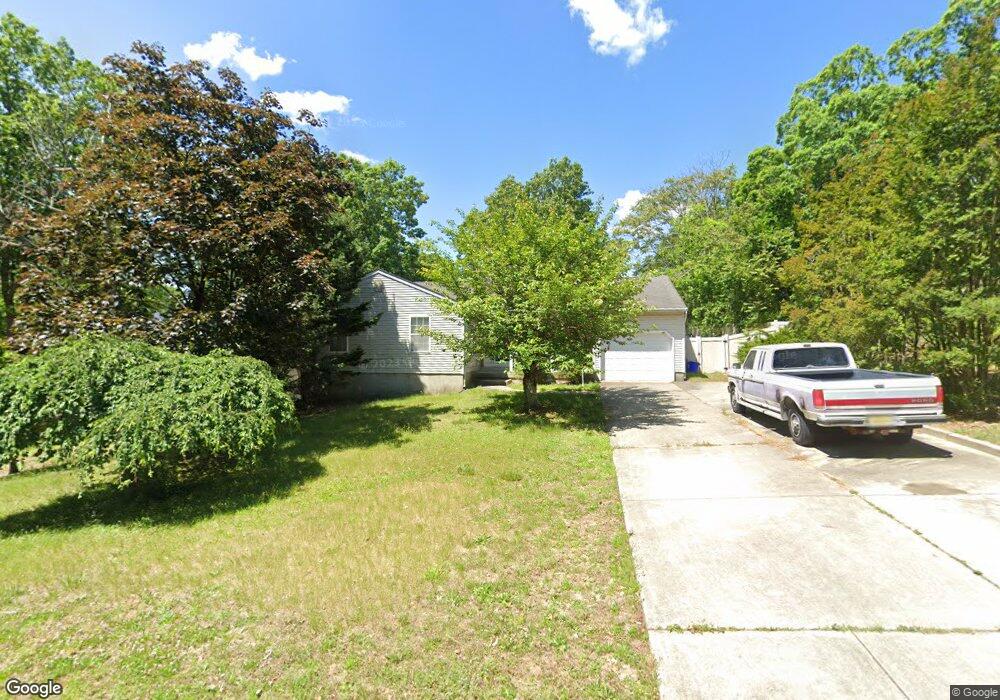
41 Spruce Ln Clementon, NJ 08021
Estimated Value: $257,000 - $332,307
--
Bed
--
Bath
1,380
Sq Ft
$220/Sq Ft
Est. Value
About This Home
This home is located at 41 Spruce Ln, Clementon, NJ 08021 and is currently estimated at $303,827, approximately $220 per square foot. 41 Spruce Ln is a home located in Camden County with nearby schools including Clementon Elementary School and South Jersey Sudbury School.
Ownership History
Date
Name
Owned For
Owner Type
Purchase Details
Closed on
Jun 24, 2005
Sold by
Schoal John
Bought by
Gaffin Reginald L
Current Estimated Value
Home Financials for this Owner
Home Financials are based on the most recent Mortgage that was taken out on this home.
Original Mortgage
$171,000
Interest Rate
5.79%
Mortgage Type
VA
Purchase Details
Closed on
Feb 29, 2000
Sold by
Estate Of Jennie Walinches
Bought by
Adams Rona R
Home Financials for this Owner
Home Financials are based on the most recent Mortgage that was taken out on this home.
Original Mortgage
$99,949
Interest Rate
8.18%
Mortgage Type
FHA
Purchase Details
Closed on
Sep 26, 1997
Sold by
Uscinowicz Benjamin M
Bought by
Walinches Jennie A
Home Financials for this Owner
Home Financials are based on the most recent Mortgage that was taken out on this home.
Original Mortgage
$58,000
Interest Rate
7.48%
Mortgage Type
FHA
Create a Home Valuation Report for This Property
The Home Valuation Report is an in-depth analysis detailing your home's value as well as a comparison with similar homes in the area
Home Values in the Area
Average Home Value in this Area
Purchase History
| Date | Buyer | Sale Price | Title Company |
|---|---|---|---|
| Gaffin Reginald L | $171,000 | -- | |
| Adams Rona R | $100,000 | -- | |
| Walinches Jennie A | $102,000 | -- |
Source: Public Records
Mortgage History
| Date | Status | Borrower | Loan Amount |
|---|---|---|---|
| Previous Owner | Gaffin Reginald L | $171,000 | |
| Previous Owner | Adams Rona R | $99,949 | |
| Previous Owner | Walinches Jennie A | $58,000 |
Source: Public Records
Tax History Compared to Growth
Tax History
| Year | Tax Paid | Tax Assessment Tax Assessment Total Assessment is a certain percentage of the fair market value that is determined by local assessors to be the total taxable value of land and additions on the property. | Land | Improvement |
|---|---|---|---|---|
| 2025 | $7,494 | $166,100 | $43,000 | $123,100 |
| 2024 | $7,362 | $166,100 | $43,000 | $123,100 |
| 2023 | $7,362 | $166,100 | $43,000 | $123,100 |
| 2022 | $7,239 | $166,100 | $43,000 | $123,100 |
| 2021 | $7,229 | $166,100 | $43,000 | $123,100 |
| 2020 | $7,141 | $166,100 | $43,000 | $123,100 |
| 2019 | $7,048 | $166,100 | $43,000 | $123,100 |
| 2018 | $7,136 | $166,100 | $43,000 | $123,100 |
| 2017 | $7,120 | $183,600 | $47,000 | $136,600 |
| 2016 | $6,861 | $183,600 | $47,000 | $136,600 |
| 2015 | $6,683 | $183,600 | $47,000 | $136,600 |
| 2014 | $6,632 | $183,600 | $47,000 | $136,600 |
Source: Public Records
Map
Nearby Homes
- 57 Hazel Ln
- 215 Erial Rd
- 148 Diamond Ave
- 26 W 1st Ave
- 32 Kirk Ln
- 97 Erial Rd
- 19 E 2nd Ave
- 91 Mount Clement Ave
- 113 Lakeview Ave
- 44 E 4th Ave
- 3 Slalom Ct
- 176 Park Ave
- 3 Chews Landing Rd
- 60 Palethorpe Ave
- 166 W Clearview Ave
- 16 E 7th Ave
- 38 Lincoln Ave
- 139 Blackwood Rd
- 200-202 Blackwood-Clementon Rd
- 243 Van Horn Ave