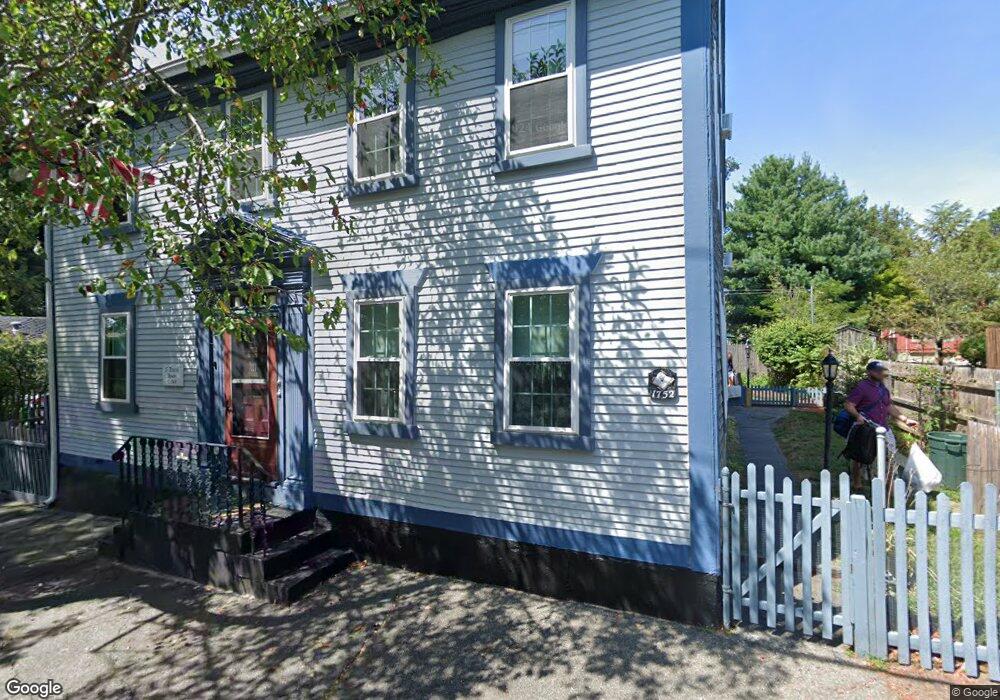
41 State St Warren, RI 02885
Downtown Warren NeighborhoodEstimated Value: $633,000 - $1,153,000
5
Beds
3
Baths
3,396
Sq Ft
$259/Sq Ft
Est. Value
About This Home
This home is located at 41 State St, Warren, RI 02885 and is currently estimated at $878,319, approximately $258 per square foot. 41 State St is a home located in Bristol County with nearby schools including Mt. Hope High School, Highlander Charter Middle and High School, and East Bay Career Academy.
Ownership History
Date
Name
Owned For
Owner Type
Purchase Details
Closed on
Sep 13, 2017
Sold by
Barrus Lori E and Barrus Lisa M
Bought by
Barrus Lori E and Barrus Lisa M
Current Estimated Value
Purchase Details
Closed on
Jun 26, 2014
Sold by
Bennett George J and Bennett Joan E
Bought by
Barrus Lori E and Barrus Lisa M
Create a Home Valuation Report for This Property
The Home Valuation Report is an in-depth analysis detailing your home's value as well as a comparison with similar homes in the area
Home Values in the Area
Average Home Value in this Area
Purchase History
| Date | Buyer | Sale Price | Title Company |
|---|---|---|---|
| Barrus Lori E | -- | -- | |
| Barrus Lori E | -- | -- |
Source: Public Records
Mortgage History
| Date | Status | Borrower | Loan Amount |
|---|---|---|---|
| Previous Owner | Barrus Lori E | $20,000 |
Source: Public Records
Tax History
| Year | Tax Paid | Tax Assessment Tax Assessment Total Assessment is a certain percentage of the fair market value that is determined by local assessors to be the total taxable value of land and additions on the property. | Land | Improvement |
|---|---|---|---|---|
| 2025 | $9,403 | $631,500 | $192,600 | $438,900 |
| 2024 | $9,119 | $631,500 | $192,600 | $438,900 |
| 2023 | $8,626 | $631,500 | $192,600 | $438,900 |
| 2022 | $7,274 | $403,900 | $121,600 | $282,300 |
| 2021 | $7,157 | $403,900 | $121,600 | $282,300 |
| 2020 | $7,043 | $405,700 | $121,600 | $284,100 |
| 2019 | $5,248 | $274,600 | $97,400 | $177,200 |
| 2018 | $5,179 | $274,600 | $97,400 | $177,200 |
| 2017 | $5,165 | $274,600 | $97,400 | $177,200 |
| 2016 | $5,036 | $252,200 | $78,600 | $173,600 |
| 2015 | $5,036 | $252,200 | $78,600 | $173,600 |
| 2014 | $5,062 | $252,200 | $78,600 | $173,600 |
Source: Public Records
Map
Nearby Homes
- 35 Church St
- 31 Child St
- 37 Warren Ave
- 21 Federal St
- 115 Market St
- 69 Cutler St
- 13 Kelly St
- 33 Melrose Ave
- 59 Ferry Ln
- 10 Jesse Davis Ln
- 74 Adams Point Rd
- 11 Mathewson Rd
- 210 Metacom Ave
- 397 Child St
- 0 Lillis Ave
- 9 Lillis Ave
- 596 Metacom Ave
- 510 Child St Unit 105B
- 510 Child St Unit 201C
- 39 Bagy Wrinkle Cove
Your Personal Tour Guide
Ask me questions while you tour the home.