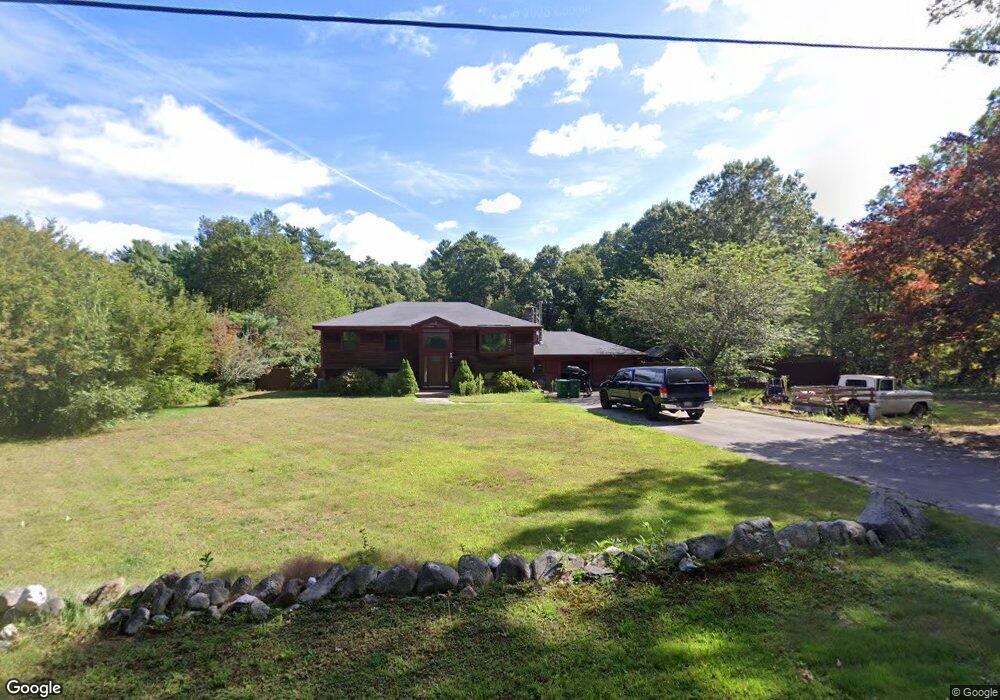
41 Stetson Heights Rd Pembroke, MA 02359
Estimated Value: $553,000 - $625,000
3
Beds
2
Baths
1,609
Sq Ft
$371/Sq Ft
Est. Value
About This Home
This home is located at 41 Stetson Heights Rd, Pembroke, MA 02359 and is currently estimated at $596,379, approximately $370 per square foot. 41 Stetson Heights Rd is a home located in Plymouth County with nearby schools including Pembroke High School.
Ownership History
Date
Name
Owned For
Owner Type
Purchase Details
Closed on
Mar 31, 2010
Sold by
Bank Of New York Mello
Bought by
Delaney Douglas
Current Estimated Value
Purchase Details
Closed on
Jun 26, 2009
Sold by
Shellmer-Klemme Linda
Bought by
Bank Of New York Mello
Purchase Details
Closed on
Jan 21, 1999
Sold by
Nesto Jacqueline E and Nesto Robert F
Bought by
Shellmer-Olson Linda
Create a Home Valuation Report for This Property
The Home Valuation Report is an in-depth analysis detailing your home's value as well as a comparison with similar homes in the area
Home Values in the Area
Average Home Value in this Area
Purchase History
| Date | Buyer | Sale Price | Title Company |
|---|---|---|---|
| Delaney Douglas | $220,000 | -- | |
| Bank Of New York Mello | $252,875 | -- | |
| Shellmer-Olson Linda | $18,000 | -- | |
| Delaney Douglas | $220,000 | -- | |
| Bank Of New York Mello | $252,875 | -- | |
| Shellmer-Olson Linda | $18,000 | -- |
Source: Public Records
Mortgage History
| Date | Status | Borrower | Loan Amount |
|---|---|---|---|
| Previous Owner | Shellmer-Olson Linda | $176,000 |
Source: Public Records
Tax History Compared to Growth
Tax History
| Year | Tax Paid | Tax Assessment Tax Assessment Total Assessment is a certain percentage of the fair market value that is determined by local assessors to be the total taxable value of land and additions on the property. | Land | Improvement |
|---|---|---|---|---|
| 2025 | $6,109 | $508,200 | $287,400 | $220,800 |
| 2024 | $6,032 | $501,400 | $282,600 | $218,800 |
| 2023 | $6,188 | $486,500 | $282,600 | $203,900 |
| 2022 | $5,684 | $401,700 | $230,800 | $170,900 |
| 2021 | $5,520 | $378,600 | $220,400 | $158,200 |
| 2020 | $5,345 | $368,900 | $210,800 | $158,100 |
| 2019 | $5,262 | $360,400 | $205,100 | $155,300 |
| 2018 | $4,912 | $329,900 | $190,300 | $139,600 |
| 2017 | $4,849 | $321,100 | $180,300 | $140,800 |
| 2016 | $4,755 | $311,600 | $170,300 | $141,300 |
| 2015 | $4,335 | $294,100 | $155,100 | $139,000 |
Source: Public Records
Map
Nearby Homes