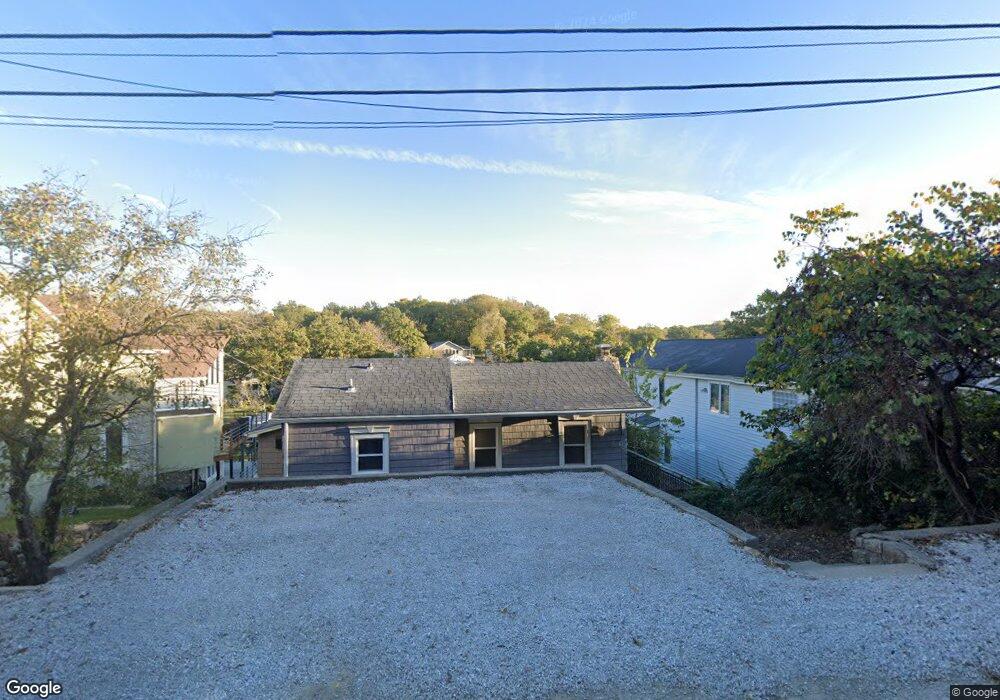
41 T St Lees Summit, MO 64086
Estimated Value: $449,321 - $509,000
3
Beds
4
Baths
944
Sq Ft
$509/Sq Ft
Est. Value
About This Home
This home is located at 41 T St, Lees Summit, MO 64086 and is currently estimated at $480,580, approximately $509 per square foot. 41 T St is a home located in Jackson County with nearby schools including Mason Elementary School, Bernard C. Campbell Middle School, and Lee's Summit North High School.
Ownership History
Date
Name
Owned For
Owner Type
Purchase Details
Closed on
Jan 19, 2010
Sold by
Britton Bill G and Britton Crystal L
Bought by
Britton Bill G and Britton Crystal L
Current Estimated Value
Purchase Details
Closed on
Nov 10, 2009
Sold by
Hagan Michael and Hagan Michelle
Bought by
Federal National Mortgage Association
Purchase Details
Closed on
Jan 13, 2009
Sold by
Federal National Mortgage Association
Bought by
Britton Bill G and Britton Crystal L
Purchase Details
Closed on
Dec 6, 2006
Sold by
Caldwell James N and Diane Caldwell A
Bought by
Hagan Michael and Hagan Michelle
Purchase Details
Closed on
Oct 1, 2004
Sold by
Yount Mark S and Yount Stacey L
Bought by
Caldwell James N and Diane Caldwell A
Home Financials for this Owner
Home Financials are based on the most recent Mortgage that was taken out on this home.
Original Mortgage
$71,485
Interest Rate
5.81%
Mortgage Type
Purchase Money Mortgage
Create a Home Valuation Report for This Property
The Home Valuation Report is an in-depth analysis detailing your home's value as well as a comparison with similar homes in the area
Home Values in the Area
Average Home Value in this Area
Purchase History
| Date | Buyer | Sale Price | Title Company |
|---|---|---|---|
| Britton Bill G | -- | Accommodation | |
| Federal National Mortgage Association | $284,312 | None Available | |
| Britton Bill G | -- | Continental Title | |
| Hagan Michael | -- | Metro One Title | |
| Caldwell James N | -- | Metro One |
Source: Public Records
Mortgage History
| Date | Status | Borrower | Loan Amount |
|---|---|---|---|
| Previous Owner | Caldwell James N | $71,485 |
Source: Public Records
Tax History
| Year | Tax Paid | Tax Assessment Tax Assessment Total Assessment is a certain percentage of the fair market value that is determined by local assessors to be the total taxable value of land and additions on the property. | Land | Improvement |
|---|---|---|---|---|
| 2025 | $5,597 | $58,546 | $49,582 | $8,964 |
| 2024 | $5,525 | $77,518 | $26,868 | $50,650 |
| 2023 | $5,525 | $77,518 | $6,857 | $70,661 |
| 2022 | $3,612 | $44,270 | $5,767 | $38,503 |
| 2021 | $3,460 | $44,270 | $5,767 | $38,503 |
| 2020 | $3,327 | $42,128 | $5,767 | $36,361 |
| 2019 | $3,236 | $42,128 | $5,767 | $36,361 |
| 2018 | $2,980 | $35,463 | $14,185 | $21,278 |
| 2016 | $2,633 | $30,837 | $14,383 | $16,454 |
Source: Public Records
Map
Nearby Homes
- 26104 E 99th St
- 22 U St
- 0000 S St
- 19 U St
- 25911 E 99th St
- 41 I St
- 25408 NE Colbern Rd
- 9301 Leviathan Ct
- 9208 SW Whispy Way
- 27315 E Acacia Dr
- 27309 Acacia Dr
- 27311 Acacia Dr
- 27307 Acacia Dr
- 27319 E Acacia Dr
- 27305 Acacia Dr
- 27317 E Acacia Dr
- 27313 E Acacia Dr
- 1121 SW Brookside Ct
- 1108 SW Whispering Willow Way
- 301 SW Amara Dr
Your Personal Tour Guide
Ask me questions while you tour the home.