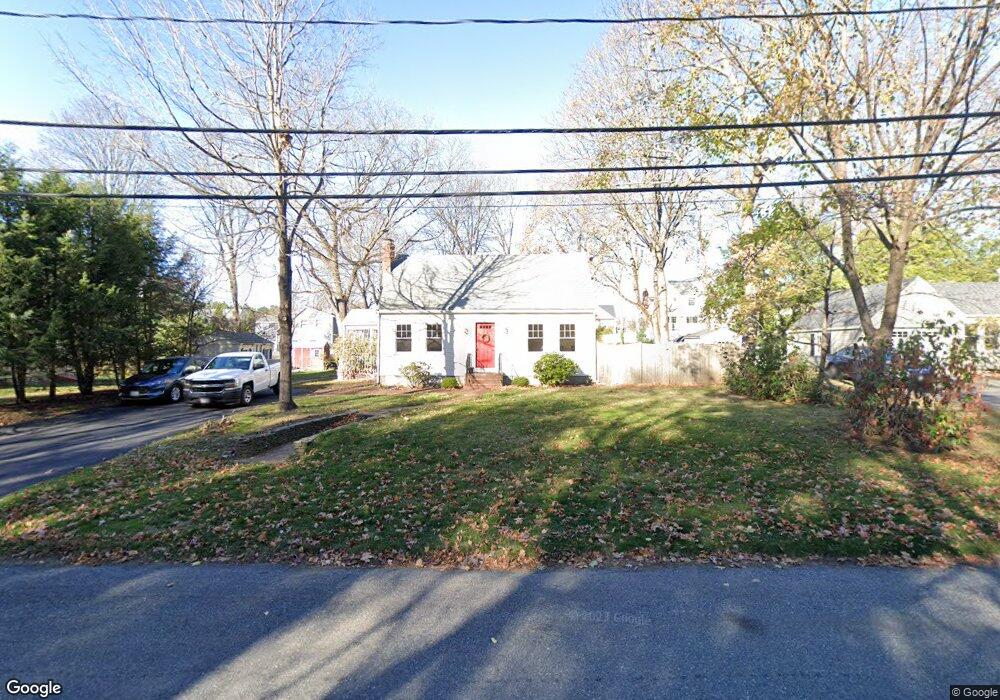
41 Turner Rd Wellesley, MA 02482
Estimated Value: $1,311,270 - $1,706,000
3
Beds
2
Baths
1,344
Sq Ft
$1,080/Sq Ft
Est. Value
About This Home
This home is located at 41 Turner Rd, Wellesley, MA 02482 and is currently estimated at $1,451,818, approximately $1,080 per square foot. 41 Turner Rd is a home located in Norfolk County with nearby schools including John D. Hardy Elementary School, Wellesley Middle School, and Wellesley Sr High School.
Ownership History
Date
Name
Owned For
Owner Type
Purchase Details
Closed on
Mar 1, 2023
Sold by
Beach Stephen H and Beach Christine H
Bought by
Turner 41 Rt
Current Estimated Value
Purchase Details
Closed on
May 10, 2018
Sold by
Beach Christine H
Bought by
Beach Christine H and Beach Stephen H
Purchase Details
Closed on
Feb 25, 2011
Sold by
Beach Iii Stephen H
Bought by
Beach Christine H
Purchase Details
Closed on
Nov 2, 2005
Sold by
Stecyk Adrian
Bought by
Beach Christine H and Beach Stephen H
Home Financials for this Owner
Home Financials are based on the most recent Mortgage that was taken out on this home.
Original Mortgage
$310,000
Interest Rate
5.85%
Mortgage Type
Purchase Money Mortgage
Create a Home Valuation Report for This Property
The Home Valuation Report is an in-depth analysis detailing your home's value as well as a comparison with similar homes in the area
Purchase History
| Date | Buyer | Sale Price | Title Company |
|---|---|---|---|
| Turner 41 Rt | -- | None Available | |
| Beach Christine H | -- | -- | |
| Beach Christine H | -- | -- | |
| Beach Christine H | $740,375 | -- |
Source: Public Records
Mortgage History
| Date | Status | Borrower | Loan Amount |
|---|---|---|---|
| Previous Owner | Beach Christine H | $310,000 |
Source: Public Records
Tax History
| Year | Tax Paid | Tax Assessment Tax Assessment Total Assessment is a certain percentage of the fair market value that is determined by local assessors to be the total taxable value of land and additions on the property. | Land | Improvement |
|---|---|---|---|---|
| 2025 | $12,028 | $1,170,000 | $1,049,000 | $121,000 |
| 2024 | $11,139 | $1,070,000 | $953,000 | $117,000 |
| 2023 | $10,900 | $952,000 | $845,000 | $107,000 |
| 2022 | $10,103 | $865,000 | $725,000 | $140,000 |
| 2021 | $9,800 | $834,000 | $694,000 | $140,000 |
| 2020 | $9,641 | $834,000 | $694,000 | $140,000 |
| 2019 | $9,279 | $802,000 | $662,000 | $140,000 |
| 2018 | $8,616 | $721,000 | $636,000 | $85,000 |
| 2017 | $8,501 | $721,000 | $636,000 | $85,000 |
| 2016 | $8,470 | $716,000 | $625,000 | $91,000 |
| 2015 | $7,930 | $686,000 | $596,000 | $90,000 |
Source: Public Records
Map
Nearby Homes
- 48 Patton Rd
- 148 Weston Rd Unit 208
- 40 Pinewood Rd
- 29 Pinewood Rd
- 25 Mansfield Rd
- 5 Wilde Rd
- 34 Pleasant St Unit 5
- 23 Pilgrim Rd
- 63 Linden St Unit 1
- 63 Linden St Unit 6
- 26 B Pleasant St Unit B
- 31 College Rd
- 63 Oak St Unit B
- 100 Linden St Unit 111
- 200 Pond Rd
- 5 Abbott St
- 16 Stearns Rd Unit 101
- 16 Stearns Rd Unit 106
- 16 Stearns Rd Unit 103
- 16 Stearns Rd Unit 304
Your Personal Tour Guide
Ask me questions while you tour the home.