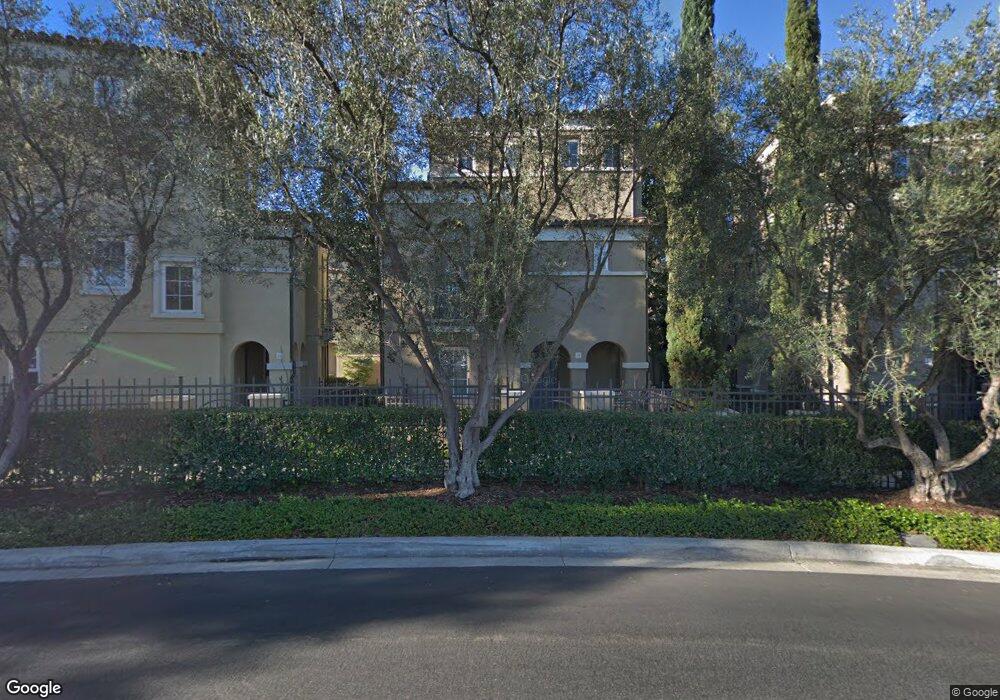
41 Via Amanti Unit 45 Newport Coast, CA 92657
Newport Coast NeighborhoodEstimated Value: $1,945,000 - $2,170,000
3
Beds
3
Baths
2,072
Sq Ft
$989/Sq Ft
Est. Value
About This Home
This home is located at 41 Via Amanti Unit 45, Newport Coast, CA 92657 and is currently estimated at $2,050,235, approximately $989 per square foot. 41 Via Amanti Unit 45 is a home located in Orange County with nearby schools including Newport Coast Elementary School, Corona del Mar Middle and High School, and Harbor Day School.
Ownership History
Date
Name
Owned For
Owner Type
Purchase Details
Closed on
Aug 12, 2021
Sold by
Sirko Jean Oakja
Bought by
Sirko Jean Oakja and Sirko Jean Oakja
Current Estimated Value
Home Financials for this Owner
Home Financials are based on the most recent Mortgage that was taken out on this home.
Original Mortgage
$228,932
Outstanding Balance
$208,170
Interest Rate
2.9%
Mortgage Type
New Conventional
Estimated Equity
$1,842,065
Purchase Details
Closed on
Jan 31, 2007
Sold by
Sirko Jean O
Bought by
Sirko Jean Oakja and Jean Oakja Sirvo Revocable Living Trust
Purchase Details
Closed on
Mar 23, 2006
Sold by
Goolsby Kimberly A
Bought by
Goolsby Michael L
Purchase Details
Closed on
Apr 4, 2003
Sold by
Greystone Homes Inc
Bought by
Sirko Robert J and Sirko Jean O
Home Financials for this Owner
Home Financials are based on the most recent Mortgage that was taken out on this home.
Original Mortgage
$322,700
Interest Rate
5.72%
Create a Home Valuation Report for This Property
The Home Valuation Report is an in-depth analysis detailing your home's value as well as a comparison with similar homes in the area
Home Values in the Area
Average Home Value in this Area
Purchase History
| Date | Buyer | Sale Price | Title Company |
|---|---|---|---|
| Sirko Jean Oakja | -- | Mortgage Connect | |
| Sirko Jean Oakja | -- | First American Title | |
| Sirko Jean Oakja | -- | None Available | |
| Goolsby Michael L | -- | Chicago Title Co | |
| Sirko Robert J | $662,000 | North American Title Ins Co |
Source: Public Records
Mortgage History
| Date | Status | Borrower | Loan Amount |
|---|---|---|---|
| Open | Sirko Jean Oakja | $228,932 | |
| Closed | Sirko Robert J | $322,700 |
Source: Public Records
Tax History Compared to Growth
Tax History
| Year | Tax Paid | Tax Assessment Tax Assessment Total Assessment is a certain percentage of the fair market value that is determined by local assessors to be the total taxable value of land and additions on the property. | Land | Improvement |
|---|---|---|---|---|
| 2025 | $10,440 | $958,773 | $618,472 | $340,301 |
| 2024 | $10,440 | $939,974 | $606,345 | $333,629 |
| 2023 | $10,196 | $921,544 | $594,456 | $327,088 |
| 2022 | $10,020 | $903,475 | $582,800 | $320,675 |
| 2021 | $9,754 | $885,760 | $571,372 | $314,388 |
| 2020 | $9,659 | $876,678 | $565,513 | $311,165 |
| 2019 | $9,462 | $859,489 | $554,425 | $305,064 |
| 2018 | $9,274 | $842,637 | $543,554 | $299,083 |
| 2017 | $9,109 | $826,115 | $532,896 | $293,219 |
| 2016 | $8,905 | $809,917 | $522,447 | $287,470 |
| 2015 | $8,818 | $797,752 | $514,600 | $283,152 |
| 2014 | $8,610 | $782,126 | $504,520 | $277,606 |
Source: Public Records
Map
Nearby Homes