41 Wall St Middleboro, MA 02346
Estimated Value: $757,675 - $859,000
5
Beds
3
Baths
2,926
Sq Ft
$279/Sq Ft
Est. Value
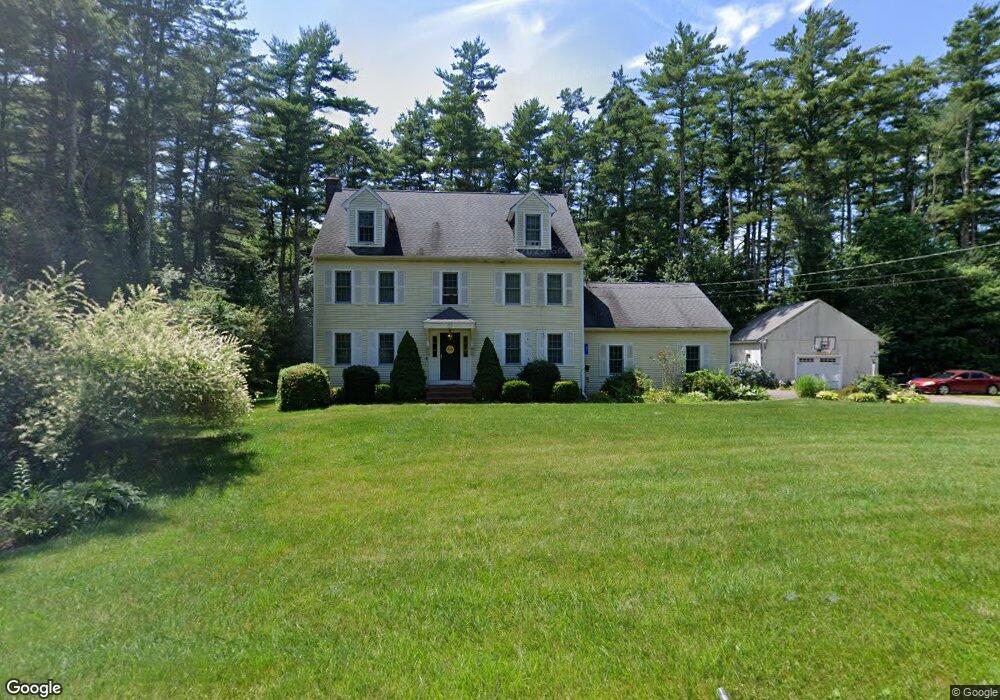
About This Home
This home is located at 41 Wall St, Middleboro, MA 02346 and is currently estimated at $815,169, approximately $278 per square foot. 41 Wall St is a home located in Plymouth County with nearby schools including Mary K. Goode Elementary School and Samuel Fuller School.
Ownership History
Date
Name
Owned For
Owner Type
Purchase Details
Closed on
Jun 16, 2008
Sold by
Wall Street Rt and Lyons Russell P
Bought by
White Lester E and White Crystal L
Current Estimated Value
Home Financials for this Owner
Home Financials are based on the most recent Mortgage that was taken out on this home.
Original Mortgage
$411,541
Interest Rate
6.13%
Mortgage Type
Purchase Money Mortgage
Purchase Details
Closed on
Apr 14, 2006
Sold by
Lyons Russell P
Bought by
Lyons Tr Russell P and Lyons Crystal G
Purchase Details
Closed on
Feb 1, 2006
Sold by
Cendant Mobilit Fncl C
Bought by
Lyons Russell P
Purchase Details
Closed on
Nov 9, 2005
Sold by
Lanum Jeff and Lanum Teresa A
Bought by
Cendant Mobilit Fncl C
Purchase Details
Closed on
May 22, 2001
Sold by
Mj Rlty Corp
Bought by
Lanum Jeff and Lanum Teresa A
Purchase Details
Closed on
Aug 30, 2000
Sold by
Oconnor Daniel F and Oconnor Janice L
Bought by
Mj Rlty Corp
Create a Home Valuation Report for This Property
The Home Valuation Report is an in-depth analysis detailing your home's value as well as a comparison with similar homes in the area
Home Values in the Area
Average Home Value in this Area
Purchase History
| Date | Buyer | Sale Price | Title Company |
|---|---|---|---|
| White Lester E | $418,000 | -- | |
| Lyons Tr Russell P | -- | -- | |
| Lyons Russell P | $473,500 | -- | |
| Cendant Mobilit Fncl C | $493,500 | -- | |
| Lanum Jeff | $310,900 | -- | |
| Mj Rlty Corp | $320,000 | -- |
Source: Public Records
Mortgage History
| Date | Status | Borrower | Loan Amount |
|---|---|---|---|
| Open | Mj Rlty Corp | $417,714 | |
| Closed | Mj Rlty Corp | $411,541 |
Source: Public Records
Tax History
| Year | Tax Paid | Tax Assessment Tax Assessment Total Assessment is a certain percentage of the fair market value that is determined by local assessors to be the total taxable value of land and additions on the property. | Land | Improvement |
|---|---|---|---|---|
| 2025 | $8,289 | $618,100 | $182,000 | $436,100 |
| 2024 | $8,247 | $609,100 | $174,000 | $435,100 |
| 2023 | $7,551 | $530,300 | $174,000 | $356,300 |
| 2022 | $7,059 | $459,000 | $152,400 | $306,600 |
| 2021 | $7,037 | $432,500 | $134,800 | $297,700 |
| 2020 | $6,816 | $429,200 | $134,800 | $294,400 |
| 2019 | $6,667 | $430,700 | $134,800 | $295,900 |
| 2018 | $6,465 | $414,400 | $128,600 | $285,800 |
| 2017 | $6,029 | $382,300 | $124,000 | $258,300 |
| 2016 | $5,932 | $372,600 | $118,000 | $254,600 |
| 2015 | $5,690 | $360,600 | $118,000 | $242,600 |
Source: Public Records
Map
Nearby Homes
Your Personal Tour Guide
Ask me questions while you tour the home.