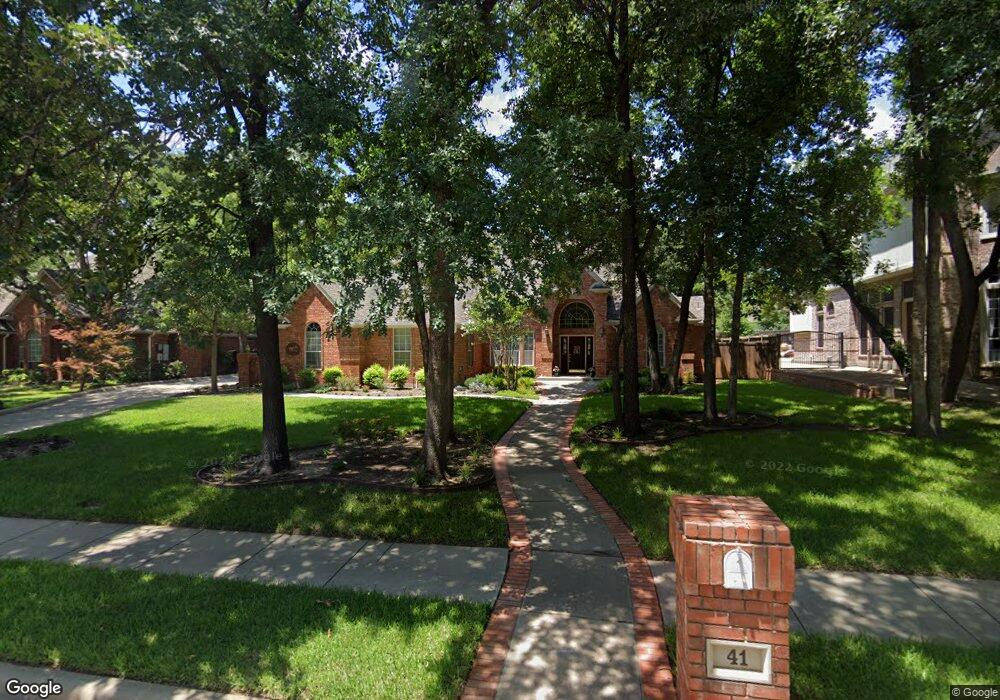
41 Wellington Oaks Cir Denton, TX 76210
South Denton NeighborhoodEstimated Value: $555,904 - $594,000
4
Beds
3
Baths
2,720
Sq Ft
$212/Sq Ft
Est. Value
About This Home
This home is located at 41 Wellington Oaks Cir, Denton, TX 76210 and is currently estimated at $577,976, approximately $212 per square foot. 41 Wellington Oaks Cir is a home located in Denton County with nearby schools including Ryan Elementary School, McMath Middle School, and Denton High School.
Ownership History
Date
Name
Owned For
Owner Type
Purchase Details
Closed on
Jun 2, 2017
Sold by
Maddox Michael E and Maddox Page D
Bought by
Littlejohn Harry Lee and Littlejohn Judy Francine
Current Estimated Value
Home Financials for this Owner
Home Financials are based on the most recent Mortgage that was taken out on this home.
Original Mortgage
$125,000
Outstanding Balance
$103,328
Interest Rate
3.97%
Mortgage Type
New Conventional
Estimated Equity
$474,648
Purchase Details
Closed on
Dec 27, 1995
Sold by
Eisenhauer Larry D and Eisenhauer Benita S
Bought by
Maddox Michael E and Maddox Page D
Home Financials for this Owner
Home Financials are based on the most recent Mortgage that was taken out on this home.
Original Mortgage
$171,100
Interest Rate
7.33%
Create a Home Valuation Report for This Property
The Home Valuation Report is an in-depth analysis detailing your home's value as well as a comparison with similar homes in the area
Home Values in the Area
Average Home Value in this Area
Purchase History
| Date | Buyer | Sale Price | Title Company |
|---|---|---|---|
| Littlejohn Harry Lee | -- | Title Resources | |
| Maddox Michael E | -- | -- | |
| Maddox Michael E | -- | -- |
Source: Public Records
Mortgage History
| Date | Status | Borrower | Loan Amount |
|---|---|---|---|
| Open | Littlejohn Harry Lee | $125,000 | |
| Previous Owner | Maddox Michael E | $171,100 | |
| Closed | Maddox Michael E | $34,222 |
Source: Public Records
Tax History Compared to Growth
Tax History
| Year | Tax Paid | Tax Assessment Tax Assessment Total Assessment is a certain percentage of the fair market value that is determined by local assessors to be the total taxable value of land and additions on the property. | Land | Improvement |
|---|---|---|---|---|
| 2025 | $4,126 | $502,286 | $173,250 | $353,856 |
| 2024 | $8,814 | $456,624 | $0 | $0 |
| 2023 | $4,133 | $415,113 | $198,000 | $397,828 |
| 2022 | $8,011 | $377,375 | $123,750 | $274,586 |
| 2021 | $7,627 | $349,180 | $99,000 | $250,180 |
| 2020 | $7,129 | $311,880 | $99,000 | $212,880 |
| 2019 | $7,542 | $316,092 | $99,000 | $217,092 |
| 2018 | $7,578 | $313,721 | $99,000 | $214,721 |
| 2017 | $7,410 | $299,794 | $99,000 | $205,069 |
| 2016 | $6,737 | $272,540 | $66,000 | $206,540 |
| 2015 | $5,782 | $263,650 | $66,000 | $197,650 |
| 2013 | -- | $242,515 | $57,750 | $184,765 |
Source: Public Records
Map
Nearby Homes
- 9 Royal Oaks Cir
- 21 Wellington Oaks Cir
- 33 Oak Forrest Cir
- 9 Oak Forrest Cir
- 100 Bentwood Ct
- 3916 Maggies Meadow
- 4100 Willow Grove Ave
- 3601 Montecito Dr
- Type - 2 Plan at Ryan Woods
- 409 Meadowlands Dr
- 3612 Granada Trail
- 28 Timbergreen Cir
- 3309 Del Mar Dr
- 3109 Forrestridge Dr
- 3805 Granada Trail
- 4200 Thistle Hill
- 900 Mallard Ave
- 301 Fairmount Ct
- 813 Turtle Creek Ave
- 3200 Belmont St
- 43 Wellington Oaks Cir
- 39 Wellington Oaks Cir
- 6 Wellington Oaks Cir
- 8 Wellington Oaks Cir
- 37 Wellington Oaks Cir
- 45 Wellington Oaks Cir
- 4 Wellington Oaks Cir
- 40 Wellington Oaks Cir
- 38 Wellington Oaks Cir
- 42 Wellington Oaks Cir
- 10 Wellington Oaks Cir
- 36 Wellington Oaks Cir
- 35 Wellington Oaks Cir
- 44 Wellington Oaks Cir
- 2 Wellington Oaks Cir
- 12 Wellington Oaks Cir
- 5 Royal Oaks Cir
- 201 Wellington Oaks Ct
- 7 Wellington Oaks Cir
- 9 Wellington Oaks Cir