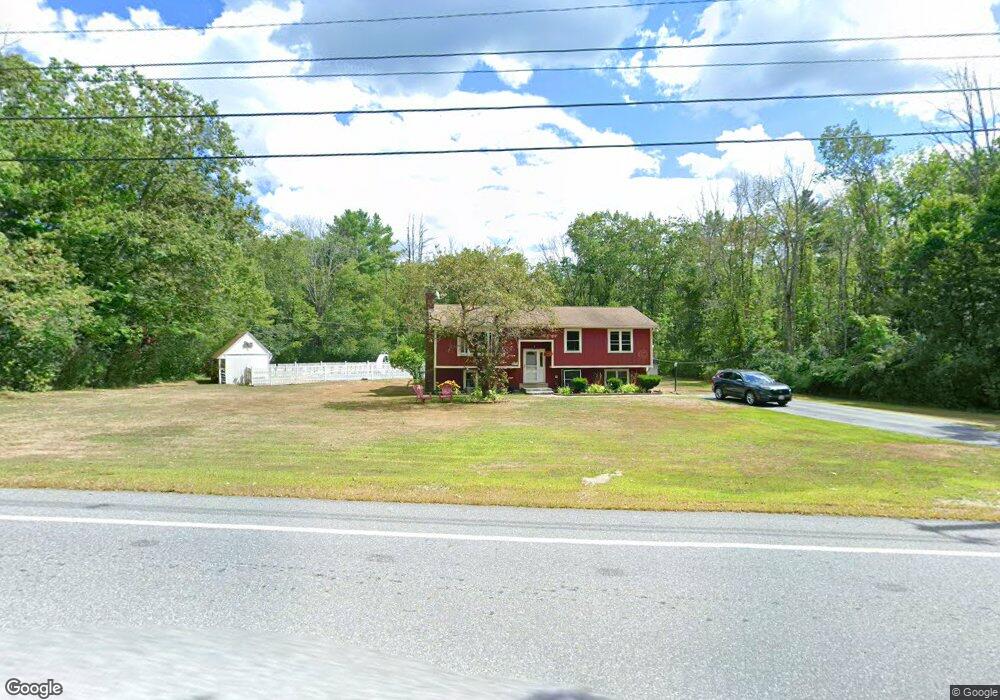
41 Williams Rd Ashburnham, MA 01430
Estimated Value: $356,000 - $391,000
2
Beds
2
Baths
1,044
Sq Ft
$360/Sq Ft
Est. Value
About This Home
This home is located at 41 Williams Rd, Ashburnham, MA 01430 and is currently estimated at $375,602, approximately $359 per square foot. 41 Williams Rd is a home located in Worcester County with nearby schools including Oakmont Regional High School and Cushing Academy.
Ownership History
Date
Name
Owned For
Owner Type
Purchase Details
Closed on
Dec 8, 1997
Sold by
Cianflone Janice L
Bought by
Cote Jeffrey P and Doiron Lori Ann
Current Estimated Value
Purchase Details
Closed on
Mar 5, 1993
Sold by
Burdick Jeanne D and Doucette Jeanne
Bought by
Girouard Thomas R
Create a Home Valuation Report for This Property
The Home Valuation Report is an in-depth analysis detailing your home's value as well as a comparison with similar homes in the area
Home Values in the Area
Average Home Value in this Area
Purchase History
| Date | Buyer | Sale Price | Title Company |
|---|---|---|---|
| Cote Jeffrey P | $54,000 | -- | |
| Cote Jeffrey P | $54,000 | -- | |
| Girouard Thomas R | $88,000 | -- | |
| Girouard Thomas R | $88,000 | -- |
Source: Public Records
Mortgage History
| Date | Status | Borrower | Loan Amount |
|---|---|---|---|
| Open | Girouard Thomas R | $160,800 | |
| Closed | Girouard Thomas R | $44,300 | |
| Closed | Girouard Thomas R | $85,570 |
Source: Public Records
Tax History
| Year | Tax Paid | Tax Assessment Tax Assessment Total Assessment is a certain percentage of the fair market value that is determined by local assessors to be the total taxable value of land and additions on the property. | Land | Improvement |
|---|---|---|---|---|
| 2025 | $4,992 | $335,700 | $45,500 | $290,200 |
| 2024 | $5,242 | $332,800 | $45,500 | $287,300 |
| 2023 | $4,849 | $293,000 | $45,500 | $247,500 |
| 2022 | $4,639 | $245,700 | $44,400 | $201,300 |
| 2021 | $4,311 | $209,800 | $44,400 | $165,400 |
| 2020 | $4,217 | $209,800 | $44,400 | $165,400 |
| 2019 | $4,424 | $196,200 | $44,400 | $151,800 |
| 2018 | $4,348 | $185,800 | $42,300 | $143,500 |
| 2017 | $3,820 | $166,300 | $39,700 | $126,600 |
| 2016 | $3,620 | $159,100 | $39,200 | $119,900 |
| 2015 | $3,569 | $160,200 | $39,200 | $121,000 |
Source: Public Records
Map
Nearby Homes
- 36 Hillandale Rd
- 75 Willard Rd
- 9 Willard Rd
- 14 Central St
- 100 Main St
- 10 Central St
- 77 Barrel Rd
- 15 Kirali Ct
- 149 Bragg Hill Rd
- Lot 6 Suffolk Ln
- Lot 5 Suffolk Ln
- 57 Ashby Rd
- 152 Ashby Rd
- 210 Bean Porridge Hill Rd
- 326 Matthews St
- 170 N Common Rd
- 280 Stone St
- 358 Winchendon Rd
- Lot 3 W State Rd
- 6 Wyman Rd
Your Personal Tour Guide
Ask me questions while you tour the home.