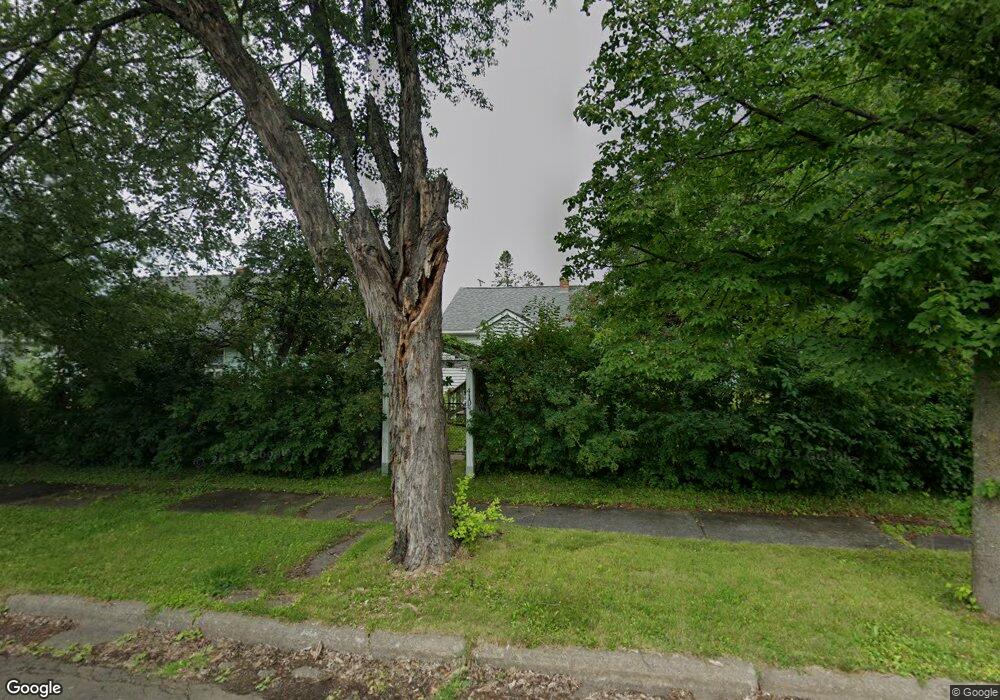
410 5th Ave N Biwabik, MN 55708
Estimated Value: $116,000 - $162,941
2
Beds
1
Bath
750
Sq Ft
$198/Sq Ft
Est. Value
About This Home
This home is located at 410 5th Ave N, Biwabik, MN 55708 and is currently estimated at $148,735, approximately $198 per square foot. 410 5th Ave N is a home located in St. Louis County with nearby schools including Mesabi East Elementary School and Mesabi East Secondary School.
Ownership History
Date
Name
Owned For
Owner Type
Purchase Details
Closed on
May 13, 2022
Sold by
Pershern Cary S and Pershern Jo Kayla
Bought by
Licari Robert
Current Estimated Value
Home Financials for this Owner
Home Financials are based on the most recent Mortgage that was taken out on this home.
Original Mortgage
$86,955
Outstanding Balance
$71,774
Interest Rate
3.91%
Mortgage Type
VA
Estimated Equity
$76,961
Purchase Details
Closed on
May 17, 2012
Sold by
Ethen Maria Katrina
Bought by
Pershern Cary Steven
Purchase Details
Closed on
Nov 14, 2008
Sold by
Bradach Steve and Bradach Katherine L
Bought by
Pershern Cary S and Ethen Maria K
Home Financials for this Owner
Home Financials are based on the most recent Mortgage that was taken out on this home.
Original Mortgage
$67,500
Interest Rate
5.95%
Mortgage Type
Purchase Money Mortgage
Purchase Details
Closed on
Dec 4, 2006
Sold by
Us Bank Na Nd
Bought by
Bradach Steve
Purchase Details
Closed on
May 26, 2005
Sold by
Maki Russell D
Bought by
Us Bank Na Nd
Create a Home Valuation Report for This Property
The Home Valuation Report is an in-depth analysis detailing your home's value as well as a comparison with similar homes in the area
Home Values in the Area
Average Home Value in this Area
Purchase History
| Date | Buyer | Sale Price | Title Company |
|---|---|---|---|
| Licari Robert | $85,000 | Northeast Title Company | |
| Pershern Cary Steven | -- | None Available | |
| Pershern Cary S | $75,000 | Ne Va | |
| Bradach Steve | $18,000 | Rels | |
| Us Bank Na Nd | $23,037 | -- |
Source: Public Records
Mortgage History
| Date | Status | Borrower | Loan Amount |
|---|---|---|---|
| Open | Licari Robert | $86,955 | |
| Previous Owner | Pershern Cary S | $67,500 |
Source: Public Records
Tax History Compared to Growth
Tax History
| Year | Tax Paid | Tax Assessment Tax Assessment Total Assessment is a certain percentage of the fair market value that is determined by local assessors to be the total taxable value of land and additions on the property. | Land | Improvement |
|---|---|---|---|---|
| 2024 | $948 | $108,400 | $9,600 | $98,800 |
| 2023 | $948 | $107,400 | $9,600 | $97,800 |
| 2022 | $852 | $63,200 | $8,200 | $55,000 |
| 2021 | $716 | $63,200 | $8,200 | $55,000 |
| 2020 | $720 | $60,800 | $8,200 | $52,600 |
| 2019 | $514 | $60,800 | $8,200 | $52,600 |
| 2018 | $436 | $60,800 | $8,200 | $52,600 |
| 2017 | $424 | $59,000 | $9,200 | $49,800 |
| 2016 | $332 | $59,000 | $9,200 | $49,800 |
| 2015 | $326 | $32,800 | $5,100 | $27,700 |
| 2014 | $326 | $34,900 | $5,000 | $29,900 |
Source: Public Records
Map
Nearby Homes
- 400 5th Ave N
- 107 N Creek Dr
- TBD Hwy 135
- 6076 Wynne Ridge Rd
- 5610 Birch Bark Landing
- 6047 Voyageurs Trail
- 5618 Birchbark Landing
- 6206 Needleleaf Rd
- 6041 Voyageurs Trail
- 6032 Voyageurs Trail
- 5047 Vermilion Trail
- 39 S Erie St
- TBD Palm Dr
- 15 N 4th St W
- 316 W 3rd Ave N
- 311 W 2nd Ave N
- 304 W 3rd Ave N
- 213 & 215 W 4th Ave N
- 23 W 4th Ave N
- 112 W 3rd Ave N
- 404 5th Ave N
- 416 5th Ave N
- 407 4th Ave N
- 424 5th Ave N
- 405 4th Ave N
- 401 4th Ave N
- 415 4th Ave N
- 421 4th Ave N
- 421 N Fourth Ave
- 421 421 N 4th Avenue--
- 421 421 N 4th Avenue--
- 421 421 N 4th-Avenue-
- 407 5th Ave N
- 501 3rd St N
- 409 5th Ave N
- 430 5th Ave N
- 425 4th Ave N
- 337 4th Ave N
- 413 5th Ave N
- 413 5th Ave N