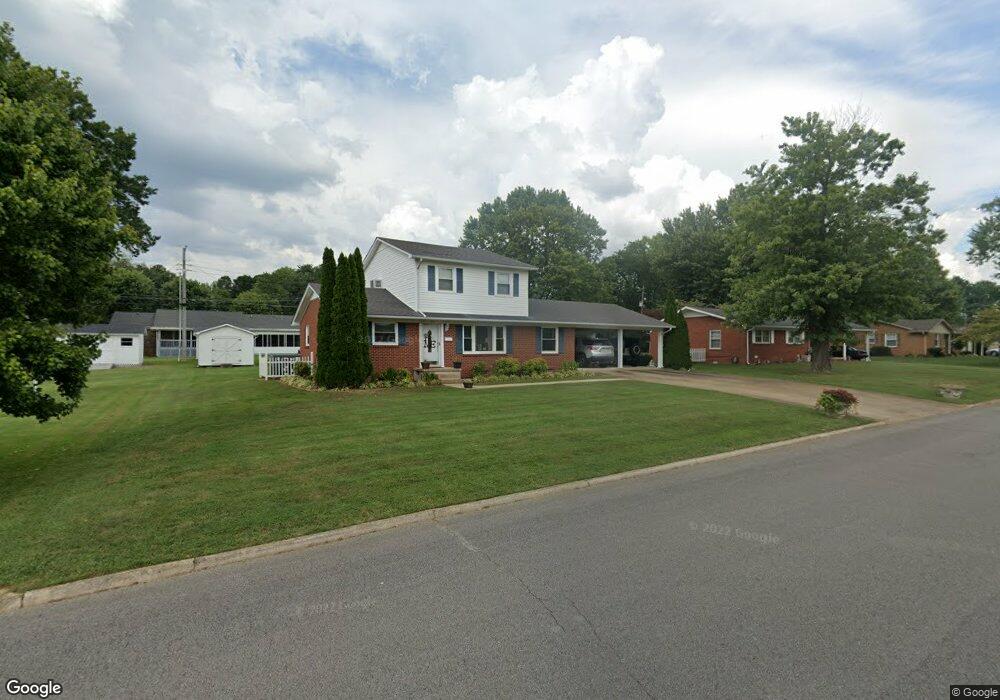
410 9th St Lawrenceburg, TN 38464
Estimated Value: $228,370 - $297,000
--
Bed
2
Baths
1,935
Sq Ft
$131/Sq Ft
Est. Value
About This Home
This home is located at 410 9th St, Lawrenceburg, TN 38464 and is currently estimated at $253,843, approximately $131 per square foot. 410 9th St is a home located in Lawrence County with nearby schools including Ingram Sowell Elementary School, Lawrenceburg Public Elementary School, and David Crockett Elementary School.
Ownership History
Date
Name
Owned For
Owner Type
Purchase Details
Closed on
Mar 17, 1999
Sold by
Kerr Danny J
Bought by
Porter Guy L and Porter Kristy M
Current Estimated Value
Purchase Details
Closed on
May 15, 1996
Sold by
Lolitta Lentz
Bought by
Kerr Danny J
Purchase Details
Closed on
Aug 31, 1989
Bought by
Lentz Lolitta and Lentz Sam
Purchase Details
Closed on
Jan 1, 1983
Bought by
Lentz Lolitta Lolitta Lentz
Purchase Details
Closed on
Jan 2, 1982
Create a Home Valuation Report for This Property
The Home Valuation Report is an in-depth analysis detailing your home's value as well as a comparison with similar homes in the area
Home Values in the Area
Average Home Value in this Area
Purchase History
| Date | Buyer | Sale Price | Title Company |
|---|---|---|---|
| Porter Guy L | $74,757 | -- | |
| Kerr Danny J | $69,500 | -- | |
| Lentz Lolitta | -- | -- | |
| Lentz Lolitta Lolitta Lentz | -- | -- | |
| -- | $52,000 | -- |
Source: Public Records
Tax History Compared to Growth
Tax History
| Year | Tax Paid | Tax Assessment Tax Assessment Total Assessment is a certain percentage of the fair market value that is determined by local assessors to be the total taxable value of land and additions on the property. | Land | Improvement |
|---|---|---|---|---|
| 2025 | $1,294 | $41,625 | $0 | $0 |
| 2024 | $1,294 | $41,625 | $5,000 | $36,625 |
| 2023 | $1,294 | $41,625 | $5,000 | $36,625 |
| 2022 | $1,294 | $41,625 | $5,000 | $36,625 |
| 2021 | $1,043 | $23,725 | $3,750 | $19,975 |
| 2020 | $1,043 | $23,725 | $3,750 | $19,975 |
| 2019 | $1,043 | $23,725 | $3,750 | $19,975 |
| 2018 | $1,043 | $23,725 | $3,750 | $19,975 |
| 2017 | $1,043 | $23,725 | $3,750 | $19,975 |
| 2016 | $1,043 | $23,725 | $3,750 | $19,975 |
| 2015 | $987 | $23,725 | $3,750 | $19,975 |
| 2014 | $913 | $21,925 | $2,500 | $19,425 |
Source: Public Records
Map
Nearby Homes