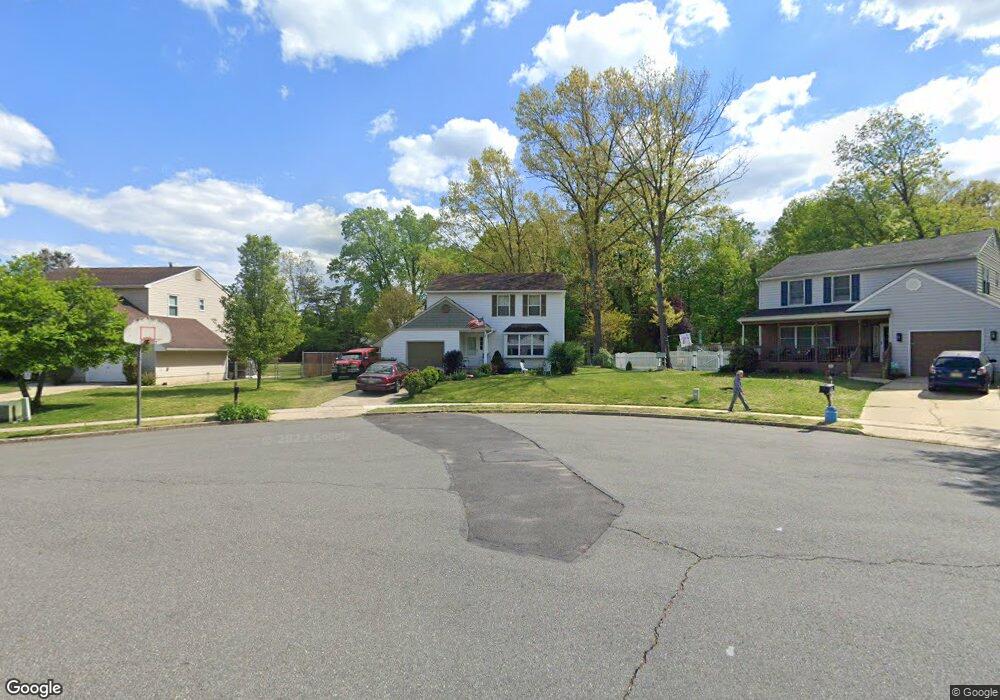
410 Acorn Rd Mount Laurel, NJ 08054
Estimated Value: $430,728 - $562,000
--
Bed
--
Bath
1,739
Sq Ft
$269/Sq Ft
Est. Value
About This Home
This home is located at 410 Acorn Rd, Mount Laurel, NJ 08054 and is currently estimated at $467,932, approximately $269 per square foot. 410 Acorn Rd is a home located in Burlington County with nearby schools including Fleetwood Elementary School, Mount Laurel Hartford School, and T.E. Harrington Middle School.
Ownership History
Date
Name
Owned For
Owner Type
Purchase Details
Closed on
Jun 19, 2015
Sold by
Mohn Randolph C and Mohn Kate E
Bought by
Mohn Randolph C
Current Estimated Value
Home Financials for this Owner
Home Financials are based on the most recent Mortgage that was taken out on this home.
Original Mortgage
$145,000
Outstanding Balance
$112,825
Interest Rate
3.88%
Mortgage Type
New Conventional
Estimated Equity
$355,107
Purchase Details
Closed on
Feb 21, 1989
Bought by
Mohn Randolph C and Mohn Kate E
Create a Home Valuation Report for This Property
The Home Valuation Report is an in-depth analysis detailing your home's value as well as a comparison with similar homes in the area
Home Values in the Area
Average Home Value in this Area
Purchase History
| Date | Buyer | Sale Price | Title Company |
|---|---|---|---|
| Mohn Randolph C | -- | Victorian Title Agency Inc | |
| Mohn Randolph C | $111,000 | -- |
Source: Public Records
Mortgage History
| Date | Status | Borrower | Loan Amount |
|---|---|---|---|
| Open | Mohn Randolph C | $145,000 |
Source: Public Records
Tax History Compared to Growth
Tax History
| Year | Tax Paid | Tax Assessment Tax Assessment Total Assessment is a certain percentage of the fair market value that is determined by local assessors to be the total taxable value of land and additions on the property. | Land | Improvement |
|---|---|---|---|---|
| 2025 | $7,659 | $242,600 | $100,000 | $142,600 |
| 2024 | $7,370 | $242,600 | $100,000 | $142,600 |
| 2023 | $7,370 | $242,600 | $100,000 | $142,600 |
| 2022 | $7,346 | $242,600 | $100,000 | $142,600 |
| 2021 | $6,672 | $242,600 | $100,000 | $142,600 |
| 2020 | $7,067 | $242,600 | $100,000 | $142,600 |
| 2019 | $6,994 | $242,600 | $100,000 | $142,600 |
| 2018 | $6,941 | $242,600 | $100,000 | $142,600 |
| 2017 | $6,761 | $242,600 | $100,000 | $142,600 |
| 2016 | $6,659 | $242,600 | $100,000 | $142,600 |
| 2015 | $6,582 | $242,600 | $100,000 | $142,600 |
| 2014 | $6,516 | $242,600 | $100,000 | $142,600 |
Source: Public Records
Map
Nearby Homes
- 607 Woodthrush Ct
- 104 Knotty Oak Dr
- 11 Evergreen Rd
- 10 Crows Nest Ct
- 512 Garden Way
- 861 Centerton Rd
- 263 Tiffany Ln
- 31 Traynor Ln
- 52 Twisting Ln
- 100 Rancocas Blvd
- 5 Birch Dr
- 6 Oak Ln
- 47 Tower Ln
- 218 Starboard Way
- 20 Starboard Way
- 67 Triangle Ln
- 120 Second St
- 10 Tucker Ct
- 4605 Grenwich Ln Unit 4605
- 11 Valley Farm Rd