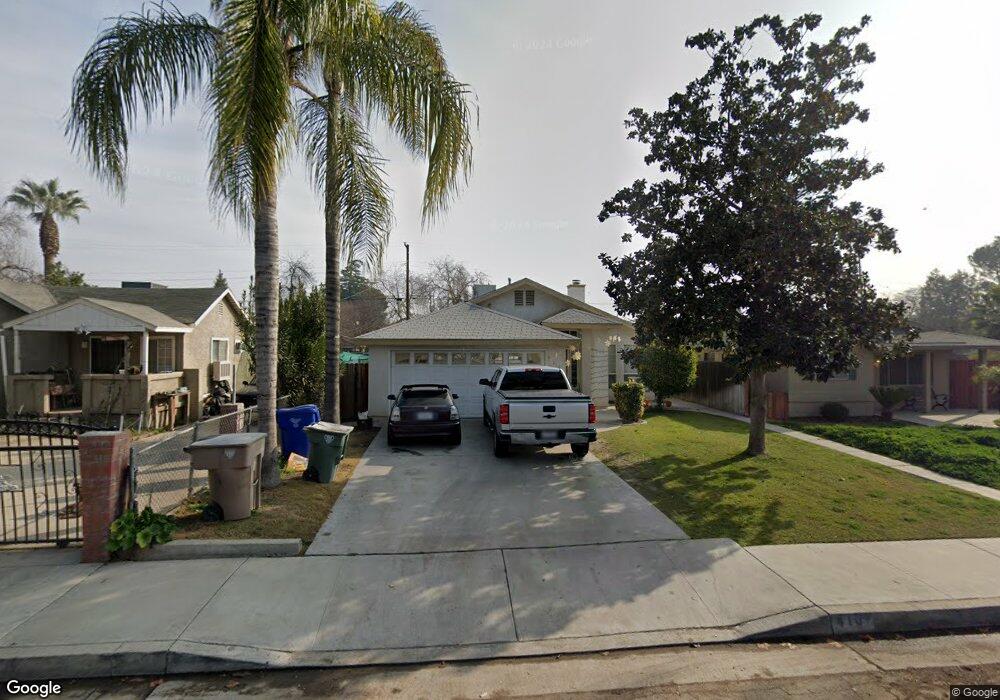
410 Beech St Bakersfield, CA 93304
Oleander-Sunset NeighborhoodEstimated Value: $262,000 - $356,000
3
Beds
2
Baths
1,632
Sq Ft
$195/Sq Ft
Est. Value
About This Home
This home is located at 410 Beech St, Bakersfield, CA 93304 and is currently estimated at $318,337, approximately $195 per square foot. 410 Beech St is a home located in Kern County with nearby schools including William Penn Elementary School, Emerson Middle School, and Bakersfield High School.
Ownership History
Date
Name
Owned For
Owner Type
Purchase Details
Closed on
Sep 6, 2005
Sold by
Moore Elizabeth
Bought by
Keveanos John D
Current Estimated Value
Purchase Details
Closed on
Jun 11, 2002
Sold by
Keveanos John D
Bought by
Moore Elizabeth
Purchase Details
Closed on
Jan 3, 2001
Sold by
Moore Elizabeth
Bought by
Moore Elizabeth and Keveanos John D
Purchase Details
Closed on
Dec 24, 1997
Sold by
Palomino Jose and Palomino Virginia
Bought by
Moore Elizabeth
Create a Home Valuation Report for This Property
The Home Valuation Report is an in-depth analysis detailing your home's value as well as a comparison with similar homes in the area
Home Values in the Area
Average Home Value in this Area
Purchase History
| Date | Buyer | Sale Price | Title Company |
|---|---|---|---|
| Keveanos John D | -- | -- | |
| Moore Elizabeth | -- | -- | |
| Moore Elizabeth | -- | -- | |
| Moore Elizabeth | $92,000 | Stewart Title |
Source: Public Records
Tax History
| Year | Tax Paid | Tax Assessment Tax Assessment Total Assessment is a certain percentage of the fair market value that is determined by local assessors to be the total taxable value of land and additions on the property. | Land | Improvement |
|---|---|---|---|---|
| 2025 | $2,402 | $146,873 | $31,921 | $114,952 |
| 2024 | $2,348 | $143,995 | $31,296 | $112,699 |
| 2023 | $2,348 | $141,173 | $30,683 | $110,490 |
| 2022 | $2,289 | $138,406 | $30,082 | $108,324 |
| 2021 | $2,182 | $135,693 | $29,493 | $106,200 |
| 2020 | $2,146 | $134,303 | $29,191 | $105,112 |
| 2019 | $2,104 | $134,303 | $29,191 | $105,112 |
| 2018 | $2,057 | $129,089 | $28,058 | $101,031 |
| 2017 | $2,045 | $126,558 | $27,508 | $99,050 |
| 2016 | $1,883 | $124,077 | $26,969 | $97,108 |
| 2015 | $1,871 | $122,214 | $26,564 | $95,650 |
| 2014 | $1,811 | $119,821 | $26,044 | $93,777 |
Source: Public Records
Map
Nearby Homes
Your Personal Tour Guide
Ask me questions while you tour the home.