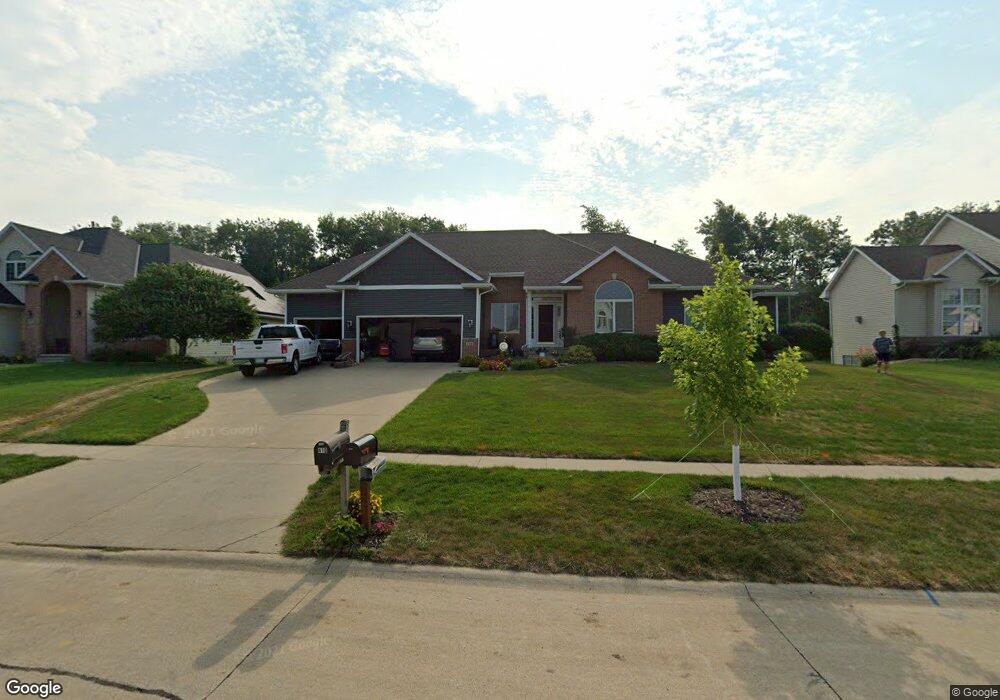
410 Brougham Rd Robins, IA 52328
Estimated Value: $465,000 - $584,000
4
Beds
5
Baths
2,118
Sq Ft
$248/Sq Ft
Est. Value
About This Home
This home is located at 410 Brougham Rd, Robins, IA 52328 and is currently estimated at $525,088, approximately $247 per square foot. 410 Brougham Rd is a home located in Linn County with nearby schools including Echo Hill Elementary School, Oak Ridge School, and Linn-Mar High School.
Ownership History
Date
Name
Owned For
Owner Type
Purchase Details
Closed on
May 30, 2017
Sold by
Rainbow June R and Rainbow Peter W
Bought by
Rainbow June R and The June R Rainbow Revocable L
Current Estimated Value
Purchase Details
Closed on
Oct 9, 2006
Sold by
Sirva Relocation Credit Llc
Bought by
Rainbow Peter W and Rainbow June R
Home Financials for this Owner
Home Financials are based on the most recent Mortgage that was taken out on this home.
Original Mortgage
$291,200
Outstanding Balance
$171,002
Interest Rate
6.36%
Mortgage Type
Purchase Money Mortgage
Estimated Equity
$354,086
Purchase Details
Closed on
Aug 23, 1999
Sold by
Koski Melvin J and Koski Judith A
Bought by
Rogers Scott E and Rogers Judith L
Home Financials for this Owner
Home Financials are based on the most recent Mortgage that was taken out on this home.
Original Mortgage
$184,000
Interest Rate
7.59%
Create a Home Valuation Report for This Property
The Home Valuation Report is an in-depth analysis detailing your home's value as well as a comparison with similar homes in the area
Home Values in the Area
Average Home Value in this Area
Purchase History
| Date | Buyer | Sale Price | Title Company |
|---|---|---|---|
| Rainbow June R | -- | None Available | |
| Rainbow Peter W | -- | None Available | |
| Rainbow Peter W | $363,500 | None Available | |
| Rogers Scott E | $33,000 | -- |
Source: Public Records
Mortgage History
| Date | Status | Borrower | Loan Amount |
|---|---|---|---|
| Open | Rainbow Peter W | $291,200 | |
| Previous Owner | Rogers Scott E | $184,000 |
Source: Public Records
Tax History
| Year | Tax Paid | Tax Assessment Tax Assessment Total Assessment is a certain percentage of the fair market value that is determined by local assessors to be the total taxable value of land and additions on the property. | Land | Improvement |
|---|---|---|---|---|
| 2025 | $7,394 | $497,600 | $54,700 | $442,900 |
| 2024 | $7,496 | $497,900 | $54,700 | $443,200 |
| 2023 | $7,496 | $497,900 | $54,700 | $443,200 |
| 2022 | $7,006 | $449,700 | $54,700 | $395,000 |
| 2021 | $7,002 | $405,900 | $54,700 | $351,200 |
| 2020 | $7,002 | $378,900 | $54,700 | $324,200 |
| 2019 | $6,452 | $350,800 | $54,700 | $296,100 |
| 2018 | $6,220 | $350,800 | $54,700 | $296,100 |
| 2017 | $6,226 | $339,200 | $54,700 | $284,500 |
| 2016 | $6,226 | $339,800 | $54,700 | $285,100 |
| 2015 | $6,220 | $338,500 | $54,700 | $283,800 |
| 2014 | $6,060 | $338,500 | $54,700 | $283,800 |
| 2013 | $5,838 | $338,500 | $54,700 | $283,800 |
Source: Public Records
Map
Nearby Homes
- 0 Maple St
- 9124 Grand Oaks Dr NE
- 8932 Norway Dr NE
- 8926 Norway Dr NE
- 165 Timber Ln
- 8608 Flatbush Ct NE
- 70.78 Acres M L Quass Rd
- 804 Palmyra Dr NE
- 929 Messina Dr NE
- 207 Meadows Field Dr NE
- 8201 Council St NE
- 1110 Capri Dr NE
- 222 Mccarran Ave NE
- 226 Mccarran Ave NE
- 219 Mccarran Ave NE
- 8806 Zeppelin Ave
- 233 Mccarran Ave NE
- 8800 Zeppelin Ave
- Lot 9 Kervin Ct
- Lot 10 Kervin Ct
- 400 Brougham Rd
- 420 Brougham Rd
- 390 Brougham Rd
- 430 Brougham Rd
- 440 Hickory Ct
- 445 Hickory Ct
- 405 Brougham Rd
- 415 Brougham Rd
- 395 Brougham Rd
- 370 Brougham Rd
- 440 Brougham Rd
- 425 Brougham Rd
- 385 Brougham Rd
- 450 Hickory Ct
- 455 Hickory Ct
- 445 Sycamore Ct
- 435 Brougham Rd
- 440 Cypress Ct
- 350 Brougham Rd
- 375 Brougham Rd
Your Personal Tour Guide
Ask me questions while you tour the home.