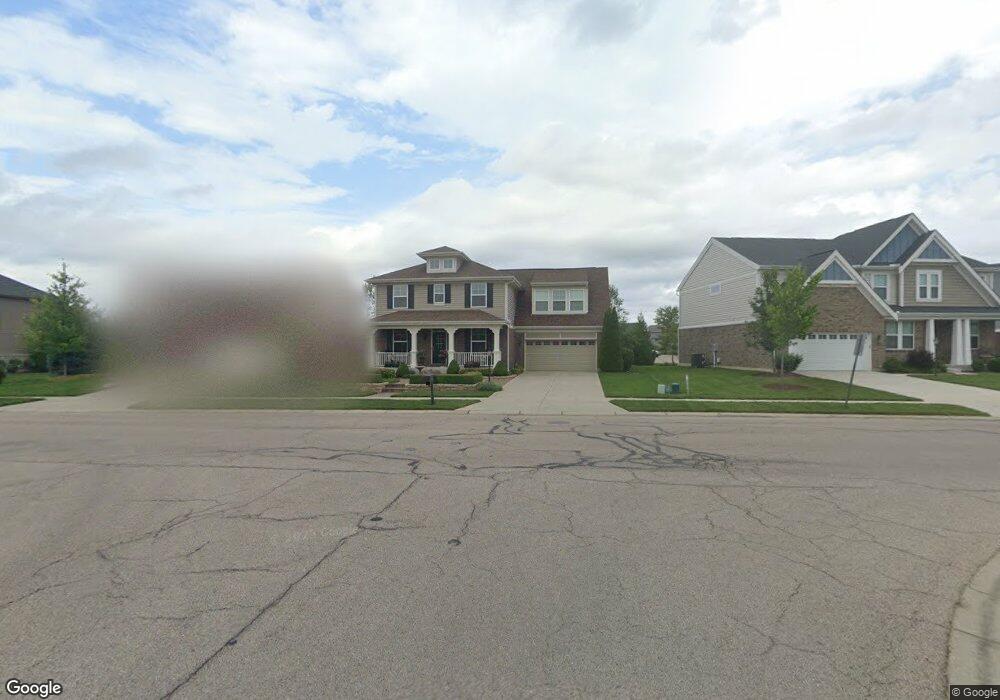
410 Clearsprings Dr Springboro, OH 45066
Clearcreek Township NeighborhoodEstimated Value: $547,185 - $603,000
4
Beds
3
Baths
2,830
Sq Ft
$201/Sq Ft
Est. Value
About This Home
This home is located at 410 Clearsprings Dr, Springboro, OH 45066 and is currently estimated at $570,046, approximately $201 per square foot. 410 Clearsprings Dr is a home with nearby schools including Clearcreek Elementary School, Springboro Intermediate School, and Springboro Junior High School.
Ownership History
Date
Name
Owned For
Owner Type
Purchase Details
Closed on
Mar 14, 2019
Sold by
Fischer Family Homes Iv Llc
Bought by
Scott David Joseph and Scott Carrie
Current Estimated Value
Home Financials for this Owner
Home Financials are based on the most recent Mortgage that was taken out on this home.
Original Mortgage
$286,387
Outstanding Balance
$251,783
Interest Rate
4.4%
Mortgage Type
New Conventional
Estimated Equity
$318,263
Purchase Details
Closed on
Aug 29, 2018
Sold by
Fischer Development Co Ii Inc
Bought by
Fischer Single Family Home Iv Ltd
Purchase Details
Closed on
Sep 30, 2010
Sold by
Sw Holdings Land Llc
Bought by
Fischer Development Co Ii Inc
Purchase Details
Closed on
Sep 29, 2010
Sold by
The Home Savings & Loan Company Of Young
Bought by
Sw Holdings Land Llc
Purchase Details
Closed on
Jan 11, 2010
Sold by
Coffman Springs Llc
Bought by
The Home Savings & Loan Company Of Young
Create a Home Valuation Report for This Property
The Home Valuation Report is an in-depth analysis detailing your home's value as well as a comparison with similar homes in the area
Home Values in the Area
Average Home Value in this Area
Purchase History
| Date | Buyer | Sale Price | Title Company |
|---|---|---|---|
| Scott David Joseph | $336,933 | Homestead Title Agency Lp | |
| Fischer Single Family Home Iv Ltd | $66,061 | None Available | |
| Fischer Development Co Ii Inc | $1,307,833 | Lawyers Title Cincinnati | |
| Sw Holdings Land Llc | $1,380,033 | Lawyers Title Cincinnati | |
| The Home Savings & Loan Company Of Young | $2,800,000 | None Available |
Source: Public Records
Mortgage History
| Date | Status | Borrower | Loan Amount |
|---|---|---|---|
| Open | Scott David Joseph | $286,387 |
Source: Public Records
Tax History Compared to Growth
Tax History
| Year | Tax Paid | Tax Assessment Tax Assessment Total Assessment is a certain percentage of the fair market value that is determined by local assessors to be the total taxable value of land and additions on the property. | Land | Improvement |
|---|---|---|---|---|
| 2024 | $6,557 | $167,900 | $35,000 | $132,900 |
| 2023 | $5,425 | $129,297 | $16,520 | $112,777 |
| 2022 | $5,425 | $129,297 | $16,520 | $112,777 |
| 2021 | $5,049 | $129,297 | $16,520 | $112,777 |
| 2020 | $4,894 | $109,575 | $14,000 | $95,575 |
| 2019 | $474 | $11,200 | $11,200 | $0 |
| 2018 | $474 | $11,200 | $11,200 | $0 |
| 2017 | $507 | $10,766 | $10,766 | $0 |
| 2016 | $528 | $10,766 | $10,766 | $0 |
| 2015 | $529 | $10,766 | $10,766 | $0 |
| 2014 | $486 | $9,360 | $9,360 | $0 |
| 2013 | $486 | $11,200 | $11,200 | $0 |
Source: Public Records
Map
Nearby Homes
- 111 Rippling Brook Ln
- 165 Waterhaven Way
- 155 Clearsprings Dr
- 285 Waterhaven Way
- 146 Rippling Brook Ln
- 5 Old Pond Rd
- 44 Old Pond Rd
- 65 Artesian Ct
- 160 Old Pond Rd
- 108 Old Pond Rd
- 163 Oasis Ct
- 195 Oasis Ct
- 270 Sycamore Springs Dr
- 10109 Gully Pass Dr
- 10090 Gully Pass Dr
- 1532 Rockleigh Rd
- 10084 Gully Pass Dr
- 88 N Glen Oak Dr
- Nicholas Plan at Washington Glen - Classic Series
- Dillon Plan at Washington Glen - Classic Series
- 450 Clear Springs Dr
- 370 Clearsprings Dr Unit 94
- 490 Clearsprings Dr
- 340 Clearsprings Dr
- 425 Clearsprings Dr
- 465 Clearsprings Dr
- 405 Clearsprings Dr
- 290 Clearsprings Dr
- 85 Rollingwood Dr
- 485 Clear Springs Dr
- 295 Clearsprings Dr Unit 151
- 295 Clearsprings Dr
- 270 Clearsprings Dr
- 275 Clearsprings Dr Unit 152
- 325 Woodstream Dr Unit 103
- 325 Woodstream Dr
- 345 Woodstream Dr
- 295 Woodstream Dr
- 250 Clearsprings Dr Unit 166
- 250 Clearsprings Dr