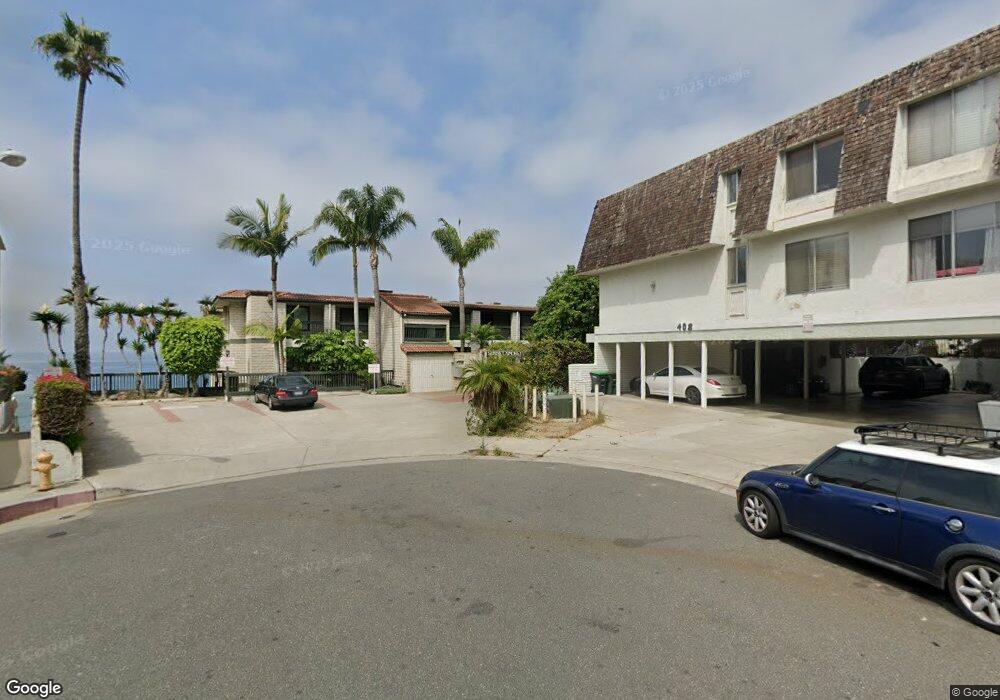
410 Corto Ln Unit 4 San Clemente, CA 92672
Central San Clemente NeighborhoodEstimated Value: $2,449,752 - $2,973,000
2
Beds
3
Baths
1,902
Sq Ft
$1,424/Sq Ft
Est. Value
About This Home
This home is located at 410 Corto Ln Unit 4, San Clemente, CA 92672 and is currently estimated at $2,707,917, approximately $1,423 per square foot. 410 Corto Ln Unit 4 is a home located in Orange County with nearby schools including Las Palmas Elementary School, Shorecliffs Middle School, and San Clemente High School.
Ownership History
Date
Name
Owned For
Owner Type
Purchase Details
Closed on
Jun 17, 2025
Sold by
Paynter David H and Paynter Robyn J
Bought by
David H Paynter And Robyn J Paynter Trust and Paynter
Current Estimated Value
Purchase Details
Closed on
Aug 1, 2017
Sold by
Hazelwood Mark
Bought by
Paynter David H and Paynter Robyn J
Home Financials for this Owner
Home Financials are based on the most recent Mortgage that was taken out on this home.
Original Mortgage
$1,125,000
Interest Rate
3.37%
Mortgage Type
Adjustable Rate Mortgage/ARM
Purchase Details
Closed on
Aug 30, 2016
Sold by
Hazelwood Mark
Bought by
Hazelwood Mark
Purchase Details
Closed on
Mar 23, 2011
Sold by
Stiny Mary Moore
Bought by
Hazelwood Mark L and Hazelwood Gloria R
Purchase Details
Closed on
Jun 6, 2000
Sold by
Elijah Stiny and Elijah Mary
Bought by
Stiny Elijah G and Stiny Mary Moore
Purchase Details
Closed on
Aug 27, 1996
Sold by
Elijah Stiny
Bought by
Stiny Elijah G and Stiny Mary L
Purchase Details
Closed on
Aug 17, 1995
Sold by
Sorley Philip C
Bought by
Stiny Elijah G
Create a Home Valuation Report for This Property
The Home Valuation Report is an in-depth analysis detailing your home's value as well as a comparison with similar homes in the area
Home Values in the Area
Average Home Value in this Area
Purchase History
| Date | Buyer | Sale Price | Title Company |
|---|---|---|---|
| David H Paynter And Robyn J Paynter Trust | -- | None Listed On Document | |
| Paynter David H | $1,725,000 | California Title Co | |
| Hazelwood Mark | -- | None Available | |
| Hazelwood Mark L | $920,000 | Landwood Title Company | |
| Stiny Elijah G | -- | -- | |
| Stiny Elijah G | -- | -- | |
| Stiny Elijah G | -- | First American Title Ins Co | |
| Stiny Elijah G | $15,500 | First American Title Ins Co |
Source: Public Records
Mortgage History
| Date | Status | Borrower | Loan Amount |
|---|---|---|---|
| Previous Owner | Paynter David H | $1,125,000 |
Source: Public Records
Tax History Compared to Growth
Tax History
| Year | Tax Paid | Tax Assessment Tax Assessment Total Assessment is a certain percentage of the fair market value that is determined by local assessors to be the total taxable value of land and additions on the property. | Land | Improvement |
|---|---|---|---|---|
| 2025 | $19,481 | $1,962,752 | $1,590,808 | $371,944 |
| 2024 | $19,481 | $1,924,267 | $1,559,616 | $364,651 |
| 2023 | $19,068 | $1,886,537 | $1,529,036 | $357,501 |
| 2022 | $18,705 | $1,849,547 | $1,499,055 | $350,492 |
| 2021 | $18,345 | $1,813,282 | $1,469,662 | $343,620 |
| 2020 | $18,162 | $1,794,690 | $1,454,593 | $340,097 |
| 2019 | $17,805 | $1,759,500 | $1,426,071 | $333,429 |
| 2018 | $17,463 | $1,725,000 | $1,398,108 | $326,892 |
| 2017 | $11,123 | $1,098,058 | $778,475 | $319,583 |
| 2016 | $10,910 | $1,076,528 | $763,211 | $313,317 |
| 2015 | $10,746 | $1,060,358 | $751,747 | $308,611 |
| 2014 | $10,395 | $1,025,136 | $722,570 | $302,566 |
Source: Public Records
Map
Nearby Homes
- 412 Arenoso Ln Unit 104
- 423 Avenida Granada Unit 54
- 255 W Marquita Unit 1
- 405 Avenida Granada Unit 212
- 405 Avenida Granada Unit 202
- 306 Avenida Cabrillo
- 420 Monterey Ln Unit R16
- 228 W Mariposa
- 251 Avenida Del Mar
- 214 W Mariposa Unit B
- 229 W Canada
- 227 Avenida Serra
- 501 Elena Ln Unit B
- 911 Buena Vista Unit 1
- 217 Vista Marina
- 251 Avenida Madrid
- 243 Avenida Madrid
- 227 W El Portal
- 121 Loma Ln
- 147 Trafalgar Ln
- 410 Corto Ln Unit K
- 410 Corto Ln Unit D
- 410 Corto Ln Unit L
- 410 Corto Ln Unit Q
- 410 Corto Ln Unit O
- 410 Corto Ln Unit B
- 410 Corto Ln Unit 13
- 410 Corto Ln Unit E
- 410 Corto Ln Unit P
- 410 Corto Ln Unit 8
- 410 Corto Ln Unit G
- 410 Corto Ln Unit 17
- 410 Corto Ln Unit 2
- 410 Corto Ln Unit 12
- 410 Corto Ln Unit F
- 410 Corto Ln Unit 1
- 410 Corto Ln Unit M
- 410 Corto Ln Unit 9
- 410 Corto Ln Unit 15
- 410 Corto Ln Unit 18