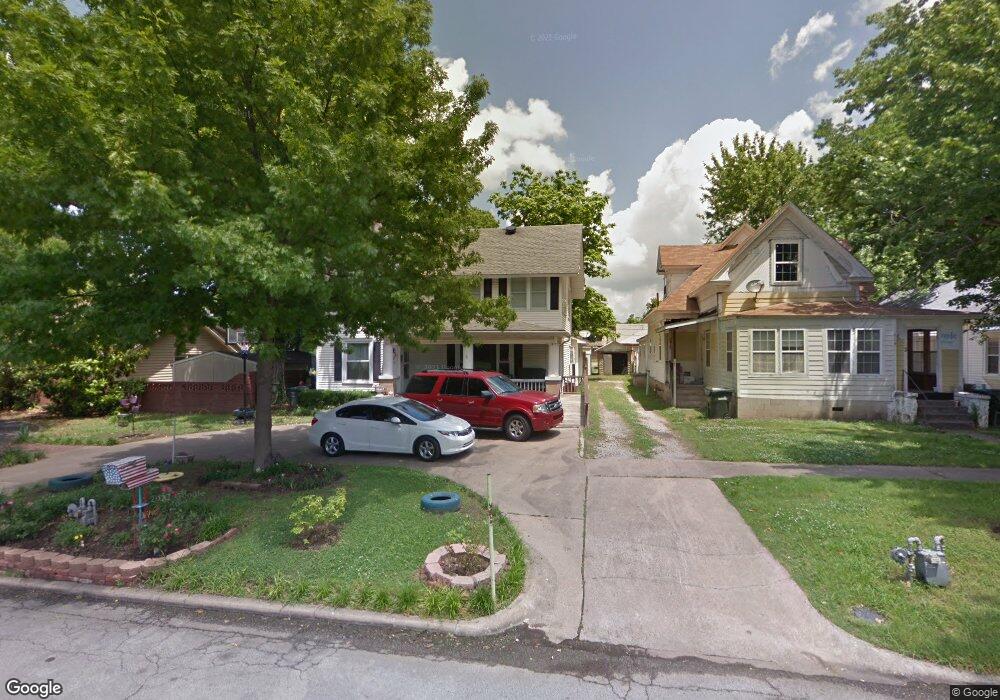
410 E 4th St Claremore, OK 74017
Estimated Value: $357,000 - $415,309
4
Beds
4
Baths
3,626
Sq Ft
$107/Sq Ft
Est. Value
About This Home
This home is located at 410 E 4th St, Claremore, OK 74017 and is currently estimated at $388,077, approximately $107 per square foot. 410 E 4th St is a home located in Rogers County with nearby schools including Claremont Elementary School, Will Rogers Junior High School, and Claremore High School.
Ownership History
Date
Name
Owned For
Owner Type
Purchase Details
Closed on
May 11, 2022
Sold by
Jean Piland Andrea
Bought by
Liberty John
Current Estimated Value
Purchase Details
Closed on
Nov 5, 2009
Sold by
Hays Brenda K and Hays Jerry David
Bought by
Hays Brenda K and Piland Andrea Jean
Purchase Details
Closed on
May 4, 2009
Sold by
U S Bank Na
Bought by
Hays Brenda K
Home Financials for this Owner
Home Financials are based on the most recent Mortgage that was taken out on this home.
Original Mortgage
$141,391
Interest Rate
4.84%
Mortgage Type
FHA
Purchase Details
Closed on
Dec 16, 2004
Sold by
Wilson Sally Ann
Purchase Details
Closed on
Sep 28, 2004
Sold by
Wilson Donald W
Purchase Details
Closed on
Sep 19, 1998
Sold by
Mcallister Gary L
Create a Home Valuation Report for This Property
The Home Valuation Report is an in-depth analysis detailing your home's value as well as a comparison with similar homes in the area
Home Values in the Area
Average Home Value in this Area
Purchase History
| Date | Buyer | Sale Price | Title Company |
|---|---|---|---|
| Liberty John | $330,000 | Apex Title | |
| Hays Brenda K | -- | None Available | |
| Hays Brenda K | $144,000 | Multipal | |
| -- | $130,000 | -- | |
| -- | -- | -- | |
| -- | $125,000 | -- |
Source: Public Records
Mortgage History
| Date | Status | Borrower | Loan Amount |
|---|---|---|---|
| Previous Owner | Hays Brenda K | $141,391 |
Source: Public Records
Tax History
| Year | Tax Paid | Tax Assessment Tax Assessment Total Assessment is a certain percentage of the fair market value that is determined by local assessors to be the total taxable value of land and additions on the property. | Land | Improvement |
|---|---|---|---|---|
| 2025 | $3,335 | $36,078 | $5,437 | $30,641 |
| 2024 | $3,355 | $36,300 | $5,934 | $30,366 |
| 2023 | $3,355 | $36,300 | $3,437 | $32,863 |
| 2022 | $1,654 | $17,865 | $3,426 | $14,439 |
| 2021 | $1,502 | $17,116 | $3,437 | $13,679 |
| 2020 | $1,484 | $16,204 | $2,782 | $13,422 |
| 2019 | $1,487 | $16,054 | $2,782 | $13,272 |
| 2018 | $1,556 | $16,835 | $2,782 | $14,053 |
| 2017 | $1,534 | $16,704 | $2,782 | $13,922 |
| 2016 | $1,527 | $16,273 | $2,782 | $13,491 |
| 2015 | $1,467 | $15,823 | $2,782 | $13,041 |
| 2014 | $1,535 | $16,552 | $2,782 | $13,770 |
Source: Public Records
Map
Nearby Homes
- 426 E Will Rogers Blvd
- 430 E Will Rogers Blvd
- 317 E 4th St
- 402 E Patti Page Blvd
- 520 E 6th St
- 321 E Patti Page Blvd
- 212 N Lavira Ave
- 403 N Choctaw Ave
- 614 E 5th St
- 221 N Dorothy Ave
- 104 W 7th St
- 2925 E Holly Rd
- 509 N Weenonah Ave
- 314 W 7th St
- 401 E Patti Page Blvd
- 507 S Maryland Ave
- 309 E Fry St
- 817 E 11th St
- 821 E 11th St
- 734 S Chickasaw Ave
Your Personal Tour Guide
Ask me questions while you tour the home.