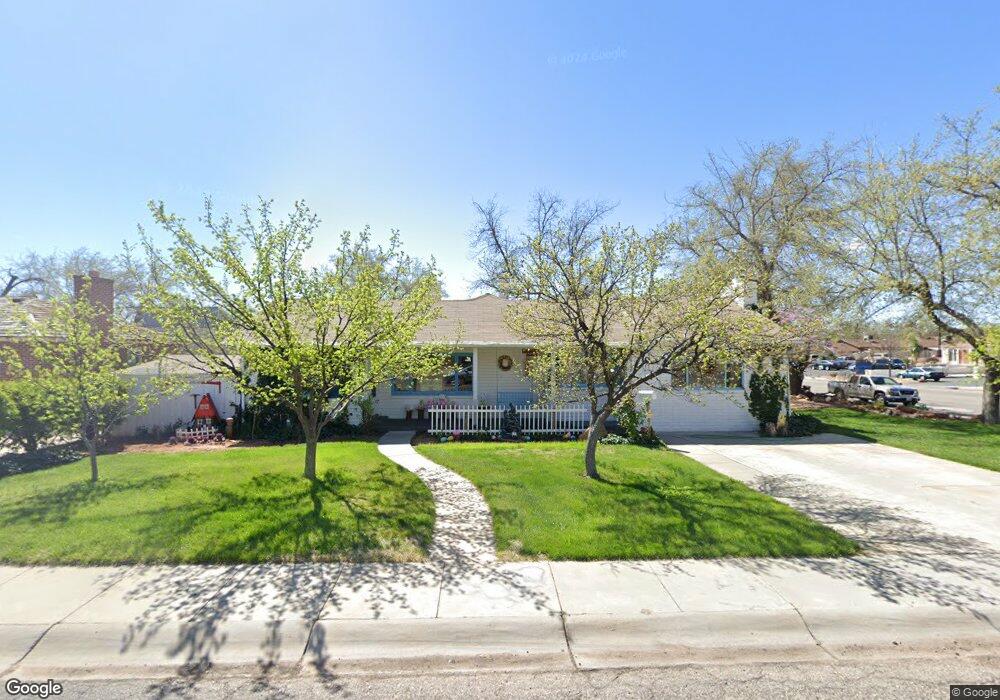
410 E 600 S Saint George, UT 84770
Estimated Value: $443,093 - $641,000
5
Beds
4
Baths
2,125
Sq Ft
$238/Sq Ft
Est. Value
About This Home
This home is located at 410 E 600 S, Saint George, UT 84770 and is currently estimated at $505,273, approximately $237 per square foot. 410 E 600 S is a home located in Washington County with nearby schools including Legacy School, Dixie Middle School, and Tonaquint Intermediate School.
Ownership History
Date
Name
Owned For
Owner Type
Purchase Details
Closed on
Sep 24, 2012
Sold by
Chamberlain Lee L and Chamberlain Anna Lee B
Bought by
Chamberlain Lee L and Chamberlain Anna Lee B
Current Estimated Value
Purchase Details
Closed on
Aug 9, 2008
Sold by
Chamberlain Lee L
Bought by
Chamberlain Lee L and Chamberlain Anna Lee B
Create a Home Valuation Report for This Property
The Home Valuation Report is an in-depth analysis detailing your home's value as well as a comparison with similar homes in the area
Purchase History
| Date | Buyer | Sale Price | Title Company |
|---|---|---|---|
| Chamberlain Lee L | -- | Southern Utah Tital Company | |
| Chamberlain Lee L | -- | Southern Utah Title | |
| Chamberlain Lee L | -- | First American Equity Loan S |
Source: Public Records
Tax History
| Year | Tax Paid | Tax Assessment Tax Assessment Total Assessment is a certain percentage of the fair market value that is determined by local assessors to be the total taxable value of land and additions on the property. | Land | Improvement |
|---|---|---|---|---|
| 2025 | $1,474 | $224,785 | $71,500 | $153,285 |
| 2023 | $1,458 | $217,910 | $46,750 | $171,160 |
| 2022 | $1,552 | $218,020 | $46,750 | $171,270 |
| 2021 | $1,426 | $298,800 | $65,000 | $233,800 |
| 2020 | $1,334 | $263,300 | $60,000 | $203,300 |
| 2019 | $1,174 | $226,300 | $60,000 | $166,300 |
| 2018 | $1,286 | $124,300 | $0 | $0 |
| 2017 | $1,177 | $113,795 | $0 | $0 |
| 2016 | $1,221 | $109,175 | $0 | $0 |
| 2015 | $1,165 | $99,880 | $0 | $0 |
| 2014 | $1,108 | $95,590 | $0 | $0 |
Source: Public Records
Map
Nearby Homes
- 443 E 700 S
- 665 S 500 E
- 464 E 700 S
- 777 S 400 E Unit 45
- 251 E 700 S
- 459 S 500 E
- 376 E 300 S Unit 2
- 840 S 400 E Unit 58
- 840 S 400 E Unit 46
- 840 S 400 E Unit 46
- 453 S 100 E Unit 8
- 339 S 600 E
- 433 S 100 E
- 701 E 900 S Unit 41
- 701 E 900 S Unit 33
- 454 S 100 E Unit 10
- 55 E 700 S Unit 8
- 295 S 200 E
- 670 E 900 S
- 197 S 600 E
Your Personal Tour Guide
Ask me questions while you tour the home.