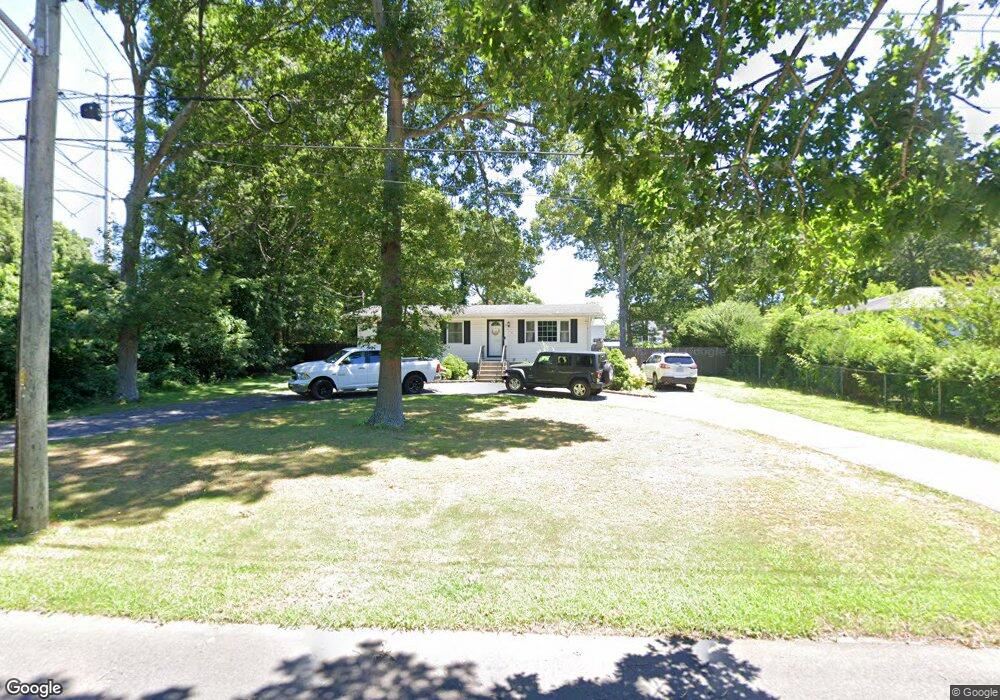
410 Free State Dr Shirley, NY 11967
Estimated Value: $415,000 - $490,466
3
Beds
1
Bath
1,008
Sq Ft
$461/Sq Ft
Est. Value
About This Home
This home is located at 410 Free State Dr, Shirley, NY 11967 and is currently estimated at $464,867, approximately $461 per square foot. 410 Free State Dr is a home located in Suffolk County with nearby schools including Longwood Junior High School, Longwood Middle School, and Longwood Senior High School.
Ownership History
Date
Name
Owned For
Owner Type
Purchase Details
Closed on
Nov 20, 2013
Sold by
Conquest James
Bought by
Vergara Jose N and Vergara Danielle F Pedene S
Current Estimated Value
Home Financials for this Owner
Home Financials are based on the most recent Mortgage that was taken out on this home.
Original Mortgage
$176,739
Outstanding Balance
$131,646
Interest Rate
4.2%
Mortgage Type
FHA
Estimated Equity
$333,221
Purchase Details
Closed on
Apr 19, 2013
Sold by
Quinn Kelly A
Bought by
Conquest James
Purchase Details
Closed on
Jul 2, 1998
Sold by
Mirrione Steven and Mirrione Kim
Bought by
Quinn Kelly A
Home Financials for this Owner
Home Financials are based on the most recent Mortgage that was taken out on this home.
Original Mortgage
$83,632
Interest Rate
6.94%
Purchase Details
Closed on
Mar 28, 1995
Sold by
Cloughen Roy and Verrier Remi
Bought by
Mirrione Steven and Mirrione Kim
Create a Home Valuation Report for This Property
The Home Valuation Report is an in-depth analysis detailing your home's value as well as a comparison with similar homes in the area
Home Values in the Area
Average Home Value in this Area
Purchase History
| Date | Buyer | Sale Price | Title Company |
|---|---|---|---|
| Vergara Jose N | $188,000 | -- | |
| Conquest James | $95,000 | -- | |
| Quinn Kelly A | $90,000 | Chicago Title Insurance Co | |
| Mirrione Steven | $77,500 | First American Title Ins Co |
Source: Public Records
Mortgage History
| Date | Status | Borrower | Loan Amount |
|---|---|---|---|
| Open | Vergara Jose N | $176,739 | |
| Previous Owner | Quinn Kelly A | $83,632 |
Source: Public Records
Tax History Compared to Growth
Tax History
| Year | Tax Paid | Tax Assessment Tax Assessment Total Assessment is a certain percentage of the fair market value that is determined by local assessors to be the total taxable value of land and additions on the property. | Land | Improvement |
|---|---|---|---|---|
| 2024 | $7,098 | $1,855 | $200 | $1,655 |
| 2023 | $7,098 | $1,855 | $200 | $1,655 |
| 2022 | $6,350 | $1,855 | $200 | $1,655 |
| 2021 | $6,350 | $1,855 | $200 | $1,655 |
| 2020 | $6,537 | $1,855 | $200 | $1,655 |
| 2019 | $6,537 | $0 | $0 | $0 |
| 2018 | $6,177 | $1,855 | $200 | $1,655 |
| 2017 | $6,177 | $1,855 | $200 | $1,655 |
| 2016 | $6,113 | $1,855 | $200 | $1,655 |
| 2015 | -- | $1,855 | $200 | $1,655 |
| 2014 | -- | $1,855 | $200 | $1,655 |
Source: Public Records
Map
Nearby Homes
- 411 Glen Dr
- 380 Wellwood Dr
- 459 Wellwood Dr
- Lot Avondale Dr
- 8 & 11 William Floyd Pkwy
- 68 Crestwood Dr
- 461 Avondale Dr
- 101 Crestwood Dr
- 334 Carnation Dr
- 1330 William Floyd Pkwy
- 509 Lockwood Dr
- 425 Puritan Dr
- 8 Stratler Dr
- 65 Colin Dr
- 149 Crestwood Dr
- 283 W End Ave
- 336 Auborn Ave
- 187 Carleton Dr E
- 567 Puritan Dr
- 500 Boxwood Dr
- 406 Free State Dr
- 402 Free State Dr
- 407 Free State Dr
- 405 Carnation Dr
- 411 Carnation Dr
- 420 Free State Dr
- 420 Freestate Dr
- 417 Free State Dr
- 403 Carnation Dr
- 398 Free State Dr
- 401 Carnation Dr
- 419 Free State Dr
- 412 Glen Dr
- 400 Glen Dr
- 76 Moriches Middle Island Rd
- 72 Moriches Middle Island Rd
- 399 Carnation Dr
- 80 Moriches Middle Island Rd
- 80 Moriches Mid Isl Rd
- Lot #6 N/C Carnation Dr