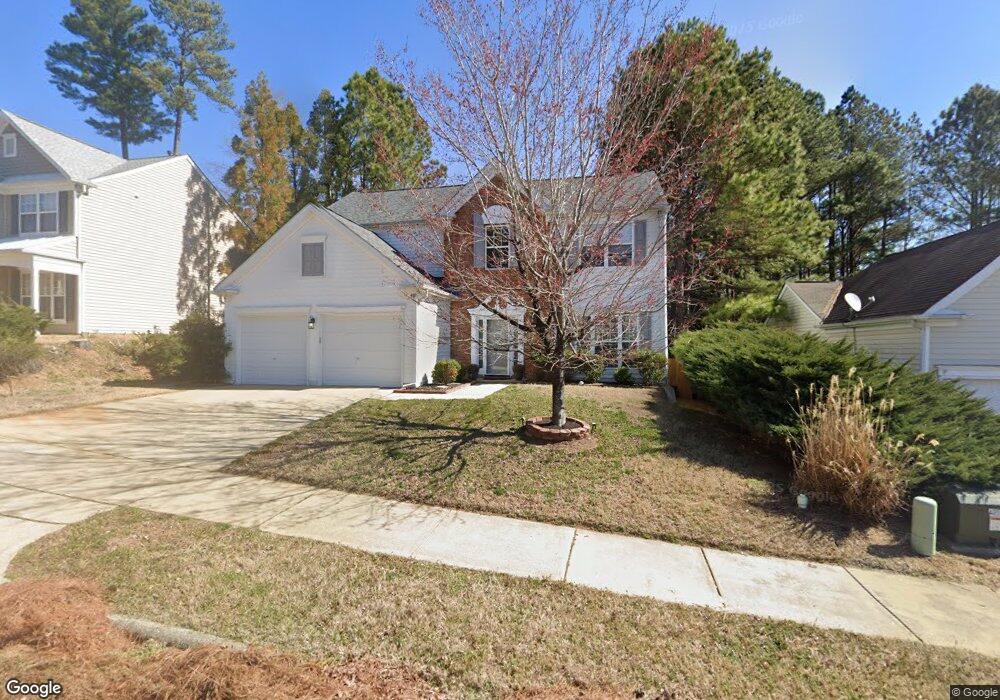
410 Grassy Point Rd Apex, NC 27502
West Apex NeighborhoodEstimated Value: $534,409 - $546,000
4
Beds
3
Baths
2,250
Sq Ft
$239/Sq Ft
Est. Value
About This Home
This home is located at 410 Grassy Point Rd, Apex, NC 27502 and is currently estimated at $538,852, approximately $239 per square foot. 410 Grassy Point Rd is a home located in Wake County with nearby schools including Olive Chapel Elementary School, Lufkin Road Middle School, and Apex Friendship High School.
Ownership History
Date
Name
Owned For
Owner Type
Purchase Details
Closed on
Nov 5, 2004
Sold by
Va
Bought by
Glapa Gary S and Glapa Aimee L
Current Estimated Value
Home Financials for this Owner
Home Financials are based on the most recent Mortgage that was taken out on this home.
Original Mortgage
$144,000
Outstanding Balance
$69,310
Interest Rate
5.25%
Mortgage Type
Purchase Money Mortgage
Estimated Equity
$469,542
Purchase Details
Closed on
Jul 19, 2004
Sold by
Lacroix Thomas F and Sacroix Sandra D
Bought by
Va
Purchase Details
Closed on
Sep 21, 2001
Sold by
Pulte Home Corp
Bought by
Lacroix Ii Thomas F and Lacroix Sandra D
Home Financials for this Owner
Home Financials are based on the most recent Mortgage that was taken out on this home.
Original Mortgage
$185,400
Interest Rate
6.97%
Mortgage Type
VA
Create a Home Valuation Report for This Property
The Home Valuation Report is an in-depth analysis detailing your home's value as well as a comparison with similar homes in the area
Home Values in the Area
Average Home Value in this Area
Purchase History
| Date | Buyer | Sale Price | Title Company |
|---|---|---|---|
| Glapa Gary S | -- | -- | |
| Va | $163,041 | -- | |
| Lacroix Ii Thomas F | $180,000 | -- |
Source: Public Records
Mortgage History
| Date | Status | Borrower | Loan Amount |
|---|---|---|---|
| Open | Glapa Gary S | $144,000 | |
| Previous Owner | Lacroix Ii Thomas F | $185,400 | |
| Closed | Glapa Gary S | $36,000 |
Source: Public Records
Tax History Compared to Growth
Tax History
| Year | Tax Paid | Tax Assessment Tax Assessment Total Assessment is a certain percentage of the fair market value that is determined by local assessors to be the total taxable value of land and additions on the property. | Land | Improvement |
|---|---|---|---|---|
| 2025 | $4,391 | $500,655 | $180,000 | $320,655 |
| 2024 | $4,293 | $500,655 | $180,000 | $320,655 |
| 2023 | $3,710 | $336,344 | $80,000 | $256,344 |
| 2022 | $3,483 | $336,344 | $80,000 | $256,344 |
| 2021 | $3,350 | $336,344 | $80,000 | $256,344 |
| 2020 | $3,316 | $336,344 | $80,000 | $256,344 |
| 2019 | $2,964 | $259,188 | $75,000 | $184,188 |
| 2018 | $2,792 | $259,188 | $75,000 | $184,188 |
| 2017 | $2,599 | $259,188 | $75,000 | $184,188 |
| 2016 | $2,561 | $259,188 | $75,000 | $184,188 |
| 2015 | $2,388 | $235,733 | $50,000 | $185,733 |
| 2014 | $2,302 | $235,733 | $50,000 | $185,733 |
Source: Public Records
Map
Nearby Homes
- 109 Kinship Ln
- 1512 Piazzo Ct
- 2007 Winecott Dr
- 1467 Hasse Ave
- 505 Brickstone Dr
- 312 Brierridge Dr
- 2799 Cassius Dr
- 2006 Driskill Ct
- 1484 Hasse Ave
- 614 Cable Ct
- 2538 Olive Chapel Rd
- 105 Grassy Ridge Ct
- 2108 Jerimouth Dr
- 2512 Livingston Ct
- 2819 Farmhouse Dr
- 2801 Farmhouse Dr
- 3916 Chapel Oak Dr
- 2524 Olive Chapel Rd
- 2528 Olive Chapel Rd
- 2530 Olive Chapel Rd
- 408 Grassy Point Rd
- 412 Grassy Point Rd
- 2529 Villagio Dr
- 2529 Villagio Dr Unit 6
- 406 Grassy Point Rd
- 2525 Villagio Dr
- 414 Grassy Point Rd
- 411 Grassy Point Rd
- 409 Grassy Point Rd
- 201 Kinship Ln
- 301 Kinship Ln
- 2528 Villagio Dr
- 404 Grassy Point Rd
- 407 Grassy Point Rd
- 111 Kinship Ln
- 2521 Villagio Dr
- 2521 Villagio Dr Unit 4
- 303 Kinship Ln
- 102 Seagroves Ct
- 405 Grassy Point Rd