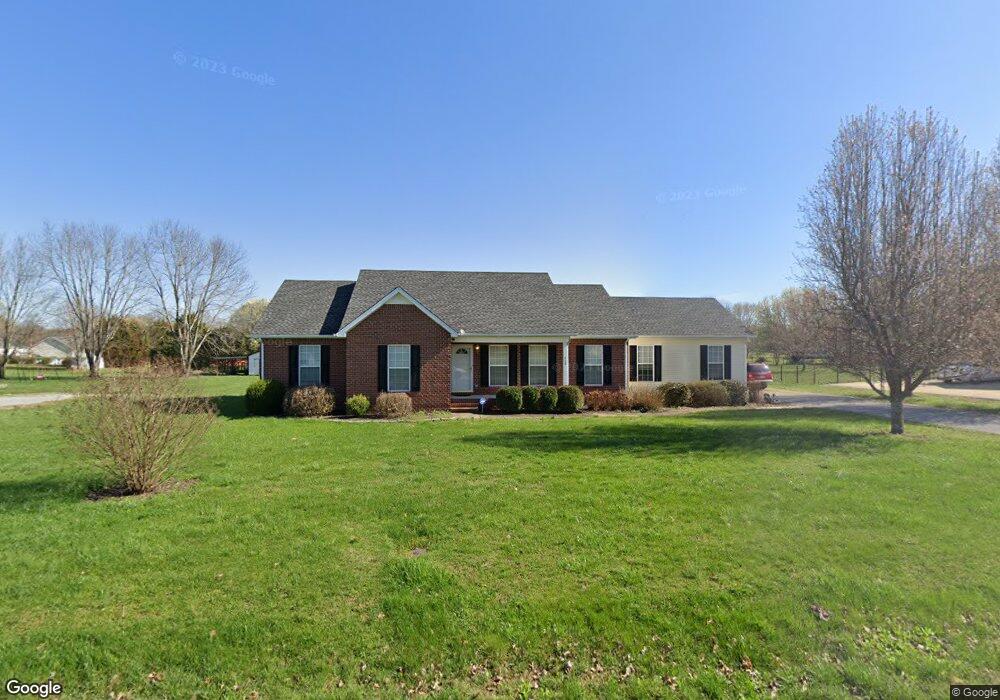
410 Meadowlark Dr Shelbyville, TN 37160
Estimated Value: $277,987 - $391,000
--
Bed
2
Baths
1,508
Sq Ft
$227/Sq Ft
Est. Value
About This Home
This home is located at 410 Meadowlark Dr, Shelbyville, TN 37160 and is currently estimated at $342,497, approximately $227 per square foot. 410 Meadowlark Dr is a home located in Bedford County with nearby schools including Liberty Elementary School, Christian Chapel Academy, and Victory Baptist Academy.
Ownership History
Date
Name
Owned For
Owner Type
Purchase Details
Closed on
Mar 3, 2005
Sold by
Brannan Jimmy
Bought by
Henson Timothy R
Current Estimated Value
Home Financials for this Owner
Home Financials are based on the most recent Mortgage that was taken out on this home.
Original Mortgage
$90,000
Outstanding Balance
$45,293
Interest Rate
5.6%
Estimated Equity
$297,204
Purchase Details
Closed on
Nov 15, 2002
Sold by
Spain Tommy and Spain Benita
Bought by
Brannan Jimmy and Brannan Leila
Purchase Details
Closed on
Jul 9, 2002
Sold by
Palmer Annette S
Bought by
Spain Tommy and Spain Benita
Purchase Details
Closed on
Jan 13, 1992
Bought by
Palmer Annette S
Purchase Details
Closed on
Jan 3, 1984
Bought by
Palmer Jack M and Palmer Annette E
Create a Home Valuation Report for This Property
The Home Valuation Report is an in-depth analysis detailing your home's value as well as a comparison with similar homes in the area
Home Values in the Area
Average Home Value in this Area
Purchase History
| Date | Buyer | Sale Price | Title Company |
|---|---|---|---|
| Henson Timothy R | $125,000 | -- | |
| Brannan Jimmy | $119,000 | -- | |
| Spain Tommy | $13,500 | -- | |
| Palmer Annette S | -- | -- | |
| Palmer Jack M | -- | -- |
Source: Public Records
Mortgage History
| Date | Status | Borrower | Loan Amount |
|---|---|---|---|
| Open | Palmer Jack M | $90,000 |
Source: Public Records
Tax History Compared to Growth
Tax History
| Year | Tax Paid | Tax Assessment Tax Assessment Total Assessment is a certain percentage of the fair market value that is determined by local assessors to be the total taxable value of land and additions on the property. | Land | Improvement |
|---|---|---|---|---|
| 2025 | $1,100 | $47,300 | $0 | $0 |
| 2024 | $1,100 | $47,300 | $8,825 | $38,475 |
| 2023 | $1,100 | $47,300 | $8,825 | $38,475 |
| 2022 | $1,100 | $47,300 | $8,825 | $38,475 |
| 2021 | $930 | $47,300 | $8,825 | $38,475 |
| 2020 | $867 | $47,300 | $8,825 | $38,475 |
| 2019 | $859 | $32,575 | $5,125 | $27,450 |
| 2018 | $826 | $32,275 | $5,125 | $27,150 |
| 2017 | $826 | $32,275 | $5,125 | $27,150 |
| 2016 | $813 | $32,275 | $5,125 | $27,150 |
| 2015 | $813 | $32,275 | $5,125 | $27,150 |
| 2014 | $704 | $31,033 | $0 | $0 |
Source: Public Records
Map
Nearby Homes
- 1519 Highway 130 E
- 0 Highway 130 E
- 1413 Highway 130 E
- 201 Sulphur Springs Rd
- 128 Riverlake Rd
- 1024 Tennessee 64
- 1725 Wartrace Pike
- 0 Himesville Rd
- 215 Coney Island Rd
- 102 Germantown Rd
- 339 Riverbend Country Club Rd
- 211 S Fairoak St
- 107 Rockwood Dr
- 1404 Cypress St
- 222 Carter St
- 314 Maplewood Dr
- 204 S Hillcrest Dr
- 112 Elizabeth St
- 231 Riverbend Country Club Rd
- 709 Belmont Ave
- 408 Meadowlark Dr
- 412 Meadowlark Dr
- 108 Oriole Cir
- 413 Meadowlark Dr
- 411 Meadowlark Dr
- 406 Meadowlark Dr
- 414 Meadowlark Dr
- 409 Meadowlark Dr
- 108 Towhee Trail
- 106 Oriole Cir
- 508 Meadowlark Dr
- 107 Oriole Cir
- 106 Towhee Trail
- 404 Meadowlark Dr
- 407 Meadowlark Dr
- 510 Meadowlark Dr
- 505 Meadowlark Dr
- 405 Meadowlark Dr
- 507 Meadowlark Dr
- 109 Towhee Trail