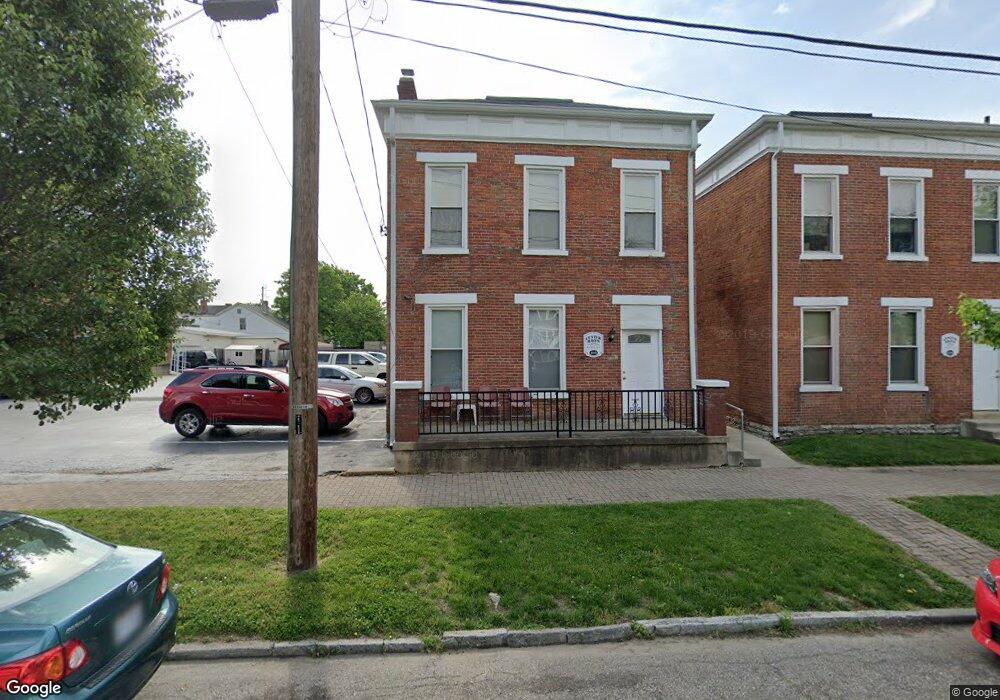
410 N 2nd St Hamilton, OH 45011
East Hamilton NeighborhoodEstimated Value: $165,000 - $187,000
5
Beds
2
Baths
2,492
Sq Ft
$71/Sq Ft
Est. Value
About This Home
This home is located at 410 N 2nd St, Hamilton, OH 45011 and is currently estimated at $176,000, approximately $70 per square foot. 410 N 2nd St is a home located in Butler County with nearby schools including Bridgeport Elementary School, Wilson Middle School, and Hamilton Freshman School.
Ownership History
Date
Name
Owned For
Owner Type
Purchase Details
Closed on
Jul 17, 2025
Sold by
Gentry James H
Bought by
Gentry Rentals Llc
Current Estimated Value
Purchase Details
Closed on
Jun 9, 2010
Sold by
Gentry Properties Llc
Bought by
Gentry James H and Gentry Margaret E
Purchase Details
Closed on
Nov 7, 2008
Sold by
Gentry James H and Gentry Margaret E
Bought by
Gentry Properties Llc
Purchase Details
Closed on
Oct 3, 2008
Sold by
Gentry James and Gentry James Harold
Bought by
Gentry James H and Gentry Margaret E
Purchase Details
Closed on
Aug 30, 1995
Sold by
Feltner C Renee
Bought by
James Gentry Trst
Home Financials for this Owner
Home Financials are based on the most recent Mortgage that was taken out on this home.
Original Mortgage
$28,000
Interest Rate
7.55%
Mortgage Type
New Conventional
Create a Home Valuation Report for This Property
The Home Valuation Report is an in-depth analysis detailing your home's value as well as a comparison with similar homes in the area
Home Values in the Area
Average Home Value in this Area
Purchase History
| Date | Buyer | Sale Price | Title Company |
|---|---|---|---|
| Gentry Rentals Llc | -- | None Listed On Document | |
| Gentry Rentals Llc | -- | None Listed On Document | |
| Gentry James H | -- | Attorney | |
| Gentry Properties Llc | -- | Attorney | |
| Gentry James H | -- | Attorney | |
| James Gentry Trst | $35,000 | -- |
Source: Public Records
Mortgage History
| Date | Status | Borrower | Loan Amount |
|---|---|---|---|
| Previous Owner | James Gentry Trst | $28,000 |
Source: Public Records
Tax History
| Year | Tax Paid | Tax Assessment Tax Assessment Total Assessment is a certain percentage of the fair market value that is determined by local assessors to be the total taxable value of land and additions on the property. | Land | Improvement |
|---|---|---|---|---|
| 2025 | $1,507 | $31,670 | $1,300 | $30,370 |
| 2024 | $1,507 | $31,670 | $1,300 | $30,370 |
| 2023 | $1,456 | $31,670 | $1,300 | $30,370 |
| 2022 | $1,163 | $20,750 | $1,300 | $19,450 |
| 2021 | $1,017 | $19,930 | $1,300 | $18,630 |
| 2020 | $1,056 | $19,930 | $1,300 | $18,630 |
| 2019 | $1,197 | $16,350 | $1,280 | $15,070 |
| 2018 | $872 | $16,350 | $1,280 | $15,070 |
| 2017 | $879 | $16,350 | $1,280 | $15,070 |
| 2016 | $911 | $16,210 | $1,280 | $14,930 |
| 2015 | $816 | $16,210 | $1,280 | $14,930 |
| 2014 | $741 | $16,210 | $1,280 | $14,930 |
| 2013 | $741 | $13,770 | $2,980 | $10,790 |
Source: Public Records
Map
Nearby Homes
Your Personal Tour Guide
Ask me questions while you tour the home.