410 Pond Bridge Rd Windsor, CT 06095
West Windsor NeighborhoodEstimated Value: $418,000 - $453,000
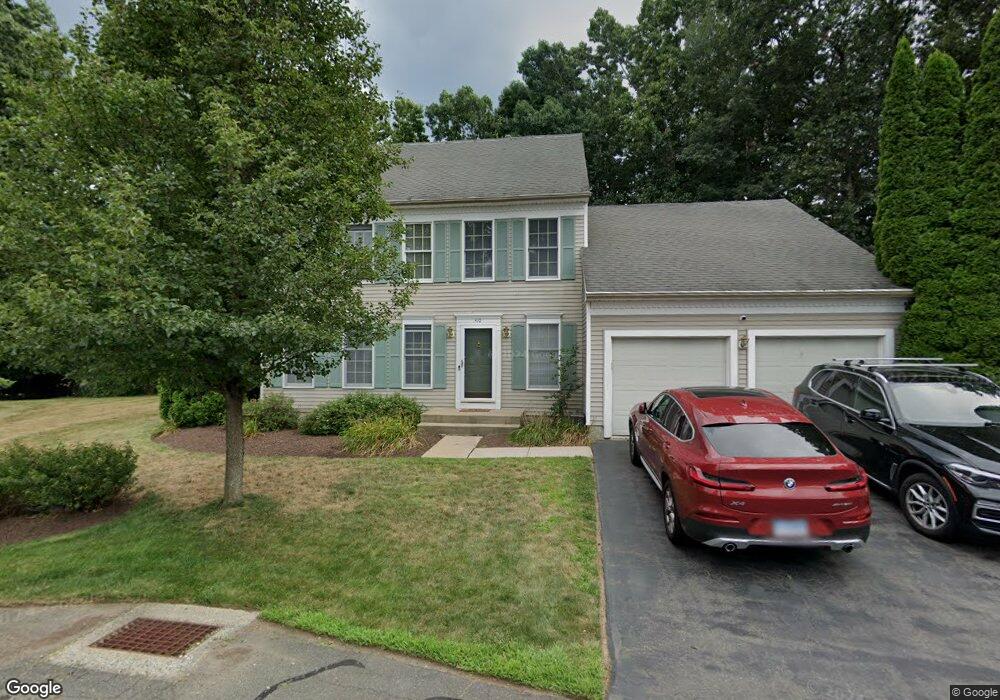
About This Home
This home is located at 410 Pond Bridge Rd, Windsor, CT 06095 and is currently estimated at $435,931, approximately $218 per square foot. 410 Pond Bridge Rd is a home located in Hartford County with nearby schools including Oliver Ellsworth School, John F. Kennedy School, and Sage Park Middle School.
Ownership History
We collect this data history from publicly available records. To have your information removed, we recommend requesting removal directly through your county’s website.
Purchase Details
Home Financials for this Owner
Home Financials are based on the most recent Mortgage that was taken out on this home.Purchase Details
Purchase Details
Purchase Details
Purchase Details
Home Values in the Area
Average Home Value in this Area
Purchase History
We collect this data history from publicly available records. To have your information removed, we recommend requesting removal directly through your county’s website.
| Date | Buyer | Sale Price | Title Company |
|---|---|---|---|
| -- | None Available | ||
| -- | None Available | ||
| $249,900 | -- | ||
| $249,900 | -- | ||
| $184,000 | -- | ||
| $184,000 | -- | ||
| $178,000 | -- | ||
| $178,000 | -- | ||
| $178,357 | -- | ||
| $178,357 | -- |
Mortgage History
We collect this data history from publicly available records. To have your information removed, we recommend requesting removal directly through your county’s website.
| Date | Status | Borrower | Loan Amount |
|---|---|---|---|
| Open | $321,530 | ||
| Closed | $321,530 | ||
| Previous Owner | $268,800 | ||
| Previous Owner | $50,400 |
Tax History
We collect this data history from publicly available records. To have your information removed, we recommend requesting removal directly through your county’s website.
| Year | Tax Paid | Tax Assessment Tax Assessment Total Assessment is a certain percentage of the fair market value that is determined by local assessors to be the total taxable value of land and additions on the property. | Land | Improvement |
|---|---|---|---|---|
| 2025 | $7,265 | $255,360 | $0 | $255,360 |
| 2024 | $7,743 | $255,360 | $0 | $255,360 |
| 2023 | $6,073 | $180,740 | $0 | $180,740 |
| 2022 | $6,013 | $180,740 | $0 | $180,740 |
| 2021 | $6,013 | $180,740 | $0 | $180,740 |
| 2020 | $5,984 | $180,740 | $0 | $180,740 |
| 2019 | $5,852 | $180,740 | $0 | $180,740 |
| 2018 | $4,679 | $141,960 | $0 | $141,960 |
| 2017 | $4,607 | $141,960 | $0 | $141,960 |
| 2016 | $4,475 | $141,960 | $0 | $141,960 |
| 2015 | $4,389 | $141,960 | $0 | $141,960 |
| 2014 | $4,326 | $141,960 | $0 | $141,960 |
Map
- 5 Haskins Rd Unit 5
- 18 Last Leaf Cir
- 32 Rhodora Terrace
- 6 Faldu Rd
- 41 Sagewood Ln Unit 41
- 10 Faldu Rd
- 39 Woodduck Farms Rd
- 31 Woodduck Farms Rd
- 1 Deanne Lynn Cir
- 1 Morello Cir
- 490 Old Day Hill Rd
- 1221 Poquonock Ave
- 63 Ethan Dr
- 20 Cornfield Rd
- 212 Ethan Dr
- 8 Old Windsor Rd
- 158 High Path Rd
- 31 Hollow Brook Rd
- 35 Hollow Brook Rd
- 268 High Path Rd Unit 268
- 416 Pond Bridge Rd
- 408 Pond Bridge Rd
- 412 Pond Bridge Rd
- 201 Picket Ln
- 411 Pond Bridge Rd
- 427 Pond Bridge Rd
- 427 Pond Bridge Rd Unit 427
- 405 Pond Bridge Rd
- 405 Pond Bridge Rd Unit 405
- 205 Picket Ln
- 407 Pond Bridge Rd
- 407 Pond Bridge Rd
- 407 Pond Bridge Rd Unit 407
- 419 Pond Bridge Rd
- 6 Dunbar Dr
- 20 Haskins Rd Unit 20
- 20 Haskins Rd
- 200 Picket Ln
- 18 Haskins Rd
- 204 Picket Ln
Ask me questions while you tour the home.