410 Redwood Trail Unit 3L Canton, GA 30114
Sutallee NeighborhoodEstimated Value: $365,797 - $409,000
3
Beds
2
Baths
1,377
Sq Ft
$281/Sq Ft
Est. Value
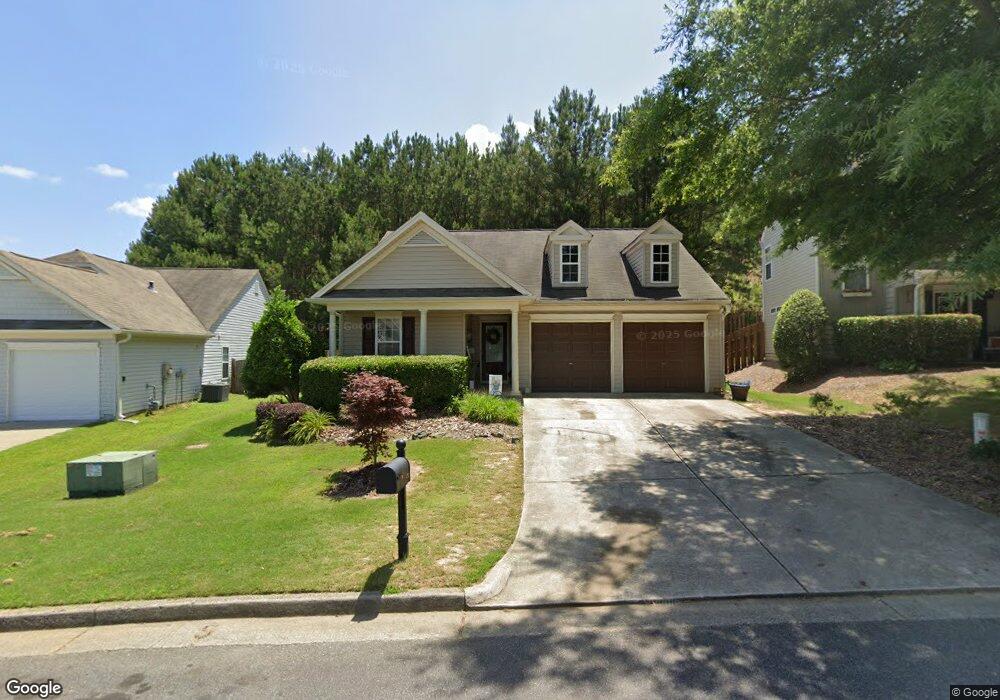
About This Home
This home is located at 410 Redwood Trail Unit 3L, Canton, GA 30114 and is currently estimated at $387,399, approximately $281 per square foot. 410 Redwood Trail Unit 3L is a home located in Cherokee County with nearby schools including Liberty Elementary School, Freedom Middle School, and Cherokee High School.
Ownership History
Date
Name
Owned For
Owner Type
Purchase Details
Closed on
Feb 22, 2021
Sold by
Stasevich Lisa
Bought by
Hembree Casandra D
Current Estimated Value
Home Financials for this Owner
Home Financials are based on the most recent Mortgage that was taken out on this home.
Original Mortgage
$251,264
Outstanding Balance
$224,728
Interest Rate
2.7%
Mortgage Type
FHA
Estimated Equity
$162,671
Purchase Details
Closed on
Mar 14, 2005
Sold by
Hinmon Bryan J
Bought by
Stasevich Mark and Stasevich Lisa
Home Financials for this Owner
Home Financials are based on the most recent Mortgage that was taken out on this home.
Original Mortgage
$125,100
Interest Rate
5.6%
Mortgage Type
New Conventional
Purchase Details
Closed on
Apr 25, 2003
Sold by
Cottages At Bridgemill Llc
Bought by
Hinmon Bryan J
Home Financials for this Owner
Home Financials are based on the most recent Mortgage that was taken out on this home.
Original Mortgage
$145,614
Interest Rate
5.6%
Mortgage Type
FHA
Create a Home Valuation Report for This Property
The Home Valuation Report is an in-depth analysis detailing your home's value as well as a comparison with similar homes in the area
Home Values in the Area
Average Home Value in this Area
Purchase History
| Date | Buyer | Sale Price | Title Company |
|---|---|---|---|
| Hembree Casandra D | $255,900 | -- | |
| Stasevich Mark | $156,400 | -- | |
| Hinmon Bryan J | $148,000 | -- |
Source: Public Records
Mortgage History
| Date | Status | Borrower | Loan Amount |
|---|---|---|---|
| Open | Hembree Casandra D | $251,264 | |
| Previous Owner | Stasevich Mark | $125,100 | |
| Previous Owner | Hinmon Bryan J | $145,614 |
Source: Public Records
Tax History Compared to Growth
Tax History
| Year | Tax Paid | Tax Assessment Tax Assessment Total Assessment is a certain percentage of the fair market value that is determined by local assessors to be the total taxable value of land and additions on the property. | Land | Improvement |
|---|---|---|---|---|
| 2024 | $3,826 | $147,244 | $30,000 | $117,244 |
| 2023 | $3,694 | $142,152 | $30,000 | $112,152 |
| 2022 | $2,690 | $102,360 | $23,778 | $78,582 |
| 2021 | $2,636 | $92,840 | $20,000 | $72,840 |
| 2020 | $2,545 | $89,560 | $20,000 | $69,560 |
| 2019 | $2,193 | $77,160 | $17,600 | $59,560 |
| 2018 | $2,026 | $70,880 | $16,400 | $54,480 |
| 2017 | $1,781 | $165,900 | $14,800 | $51,560 |
| 2016 | $1,781 | $152,900 | $13,600 | $47,560 |
| 2015 | $1,736 | $147,600 | $13,600 | $45,440 |
| 2014 | $1,648 | $139,900 | $12,000 | $43,960 |
Source: Public Records
Map
Nearby Homes
- 113 Gold Bridge Crossing
- 3085 Woodbridge Ln
- 3087 Woodbridge Ln Unit 3L
- 429 Arrowhead Trail
- 410 Arrowhead Trail
- 422 Arrowhead Trail
- 1383 Bridge Mill Ave
- 312 Gold Mill Trail
- 645 Mile Branch Rd
- 2018 Boxwood Ln
- 4123 Gold Mill Ridge
- 139 Gold Mill Place Unit 4F
- 152 Gold Mill Place Unit 4F
- 283 Villa Creek Pkwy Unit 35
- 229 Crestwood Dr
- 342 Providence Walk Way
- 272 Deer Valley Run
- 412
- 408 Redwood Trail
- 408 Redwood Trail
- 412 Redwood Trail
- 318 White Oak Way
- 311 White Oak Way
- 406 Redwood Trail
- 320 White Oak Way
- 404 Redwood Trail
- 409 Redwood Trail
- 411 Redwood Trail
- 322 White Oak Way
- 0 White Oak Way Unit 8135097
- 0 White Oak Way
- 0 Redwood Trail Unit 7490619
- 0 Redwood Trail Unit 7409741
- 0 Redwood Trail Unit 7272786
- 0 Redwood Trail Unit 7039604
- 0 Redwood Trail Unit 8822230
- 0 Redwood Trail Unit 8727900