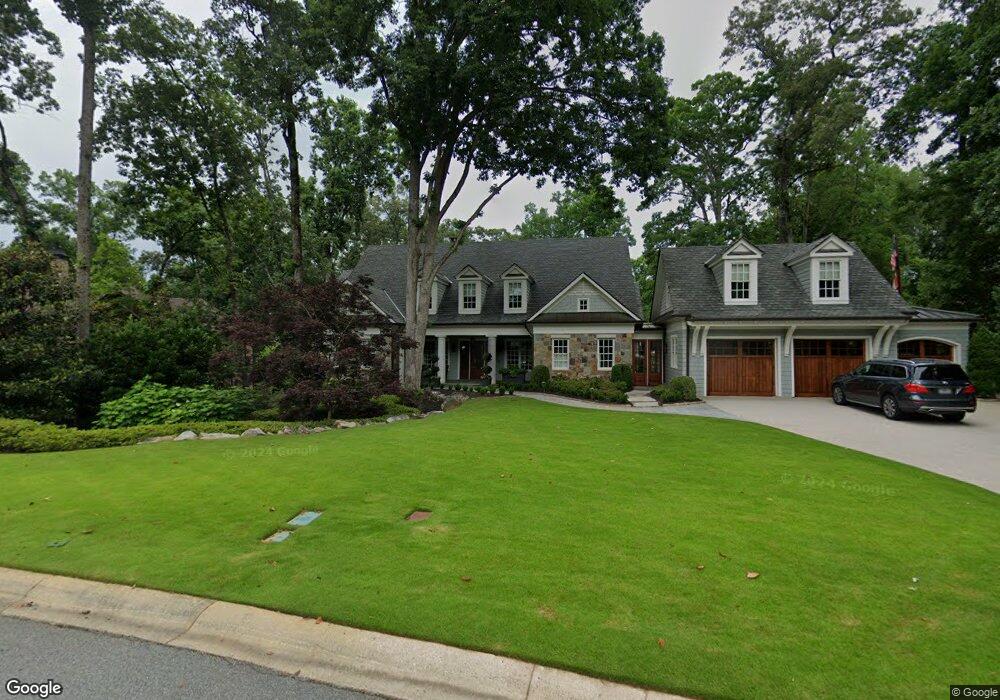
410 Tam Oshanter Dr SE Unit 3 Marietta, GA 30067
Atlanta Country Club Estates NeighborhoodEstimated Value: $1,875,000 - $3,084,000
5
Beds
5
Baths
6,516
Sq Ft
$354/Sq Ft
Est. Value
About This Home
This home is located at 410 Tam Oshanter Dr SE Unit 3, Marietta, GA 30067 and is currently estimated at $2,309,143, approximately $354 per square foot. 410 Tam Oshanter Dr SE Unit 3 is a home located in Cobb County with nearby schools including Sope Creek Elementary School, Dickerson Middle School, and Mt. Bethel Christian Academy.
Ownership History
Date
Name
Owned For
Owner Type
Purchase Details
Closed on
Jun 25, 2004
Sold by
National Residl Nominee & Svcs
Bought by
Arundel Michael J
Current Estimated Value
Home Financials for this Owner
Home Financials are based on the most recent Mortgage that was taken out on this home.
Original Mortgage
$584,000
Outstanding Balance
$275,582
Interest Rate
5.38%
Mortgage Type
New Conventional
Estimated Equity
$2,033,561
Purchase Details
Closed on
Apr 29, 2004
Sold by
Rogers Michael E and Rogers Angeline N
Bought by
National Residl Nominee Svcs In
Home Financials for this Owner
Home Financials are based on the most recent Mortgage that was taken out on this home.
Original Mortgage
$584,000
Outstanding Balance
$275,582
Interest Rate
5.38%
Mortgage Type
New Conventional
Estimated Equity
$2,033,561
Purchase Details
Closed on
Feb 22, 2002
Sold by
Rowe Robert P and Jeanie S
Bought by
Rogers Michael E and Rogers Angeline N
Home Financials for this Owner
Home Financials are based on the most recent Mortgage that was taken out on this home.
Original Mortgage
$30,000
Interest Rate
6.81%
Mortgage Type
New Conventional
Purchase Details
Closed on
Jul 9, 1996
Sold by
Chkoreff Betty Jean
Bought by
Rowe Robert P and Jeanie Ogburn S
Create a Home Valuation Report for This Property
The Home Valuation Report is an in-depth analysis detailing your home's value as well as a comparison with similar homes in the area
Home Values in the Area
Average Home Value in this Area
Purchase History
| Date | Buyer | Sale Price | Title Company |
|---|---|---|---|
| Arundel Michael J | $730,000 | -- | |
| National Residl Nominee Svcs In | $730,000 | -- | |
| Rogers Michael E | $580,000 | -- | |
| Rowe Robert P | $255,000 | -- |
Source: Public Records
Mortgage History
| Date | Status | Borrower | Loan Amount |
|---|---|---|---|
| Open | Arundel Michael J | $584,000 | |
| Previous Owner | National Residl Nominee Svcs In | $73,000 | |
| Previous Owner | Rogers Michael E | $30,000 | |
| Closed | Rowe Robert P | $0 |
Source: Public Records
Tax History Compared to Growth
Tax History
| Year | Tax Paid | Tax Assessment Tax Assessment Total Assessment is a certain percentage of the fair market value that is determined by local assessors to be the total taxable value of land and additions on the property. | Land | Improvement |
|---|---|---|---|---|
| 2024 | $5,434 | $551,692 | $194,000 | $357,692 |
| 2023 | $5,279 | $568,688 | $194,000 | $374,688 |
| 2022 | $5,353 | $524,496 | $194,000 | $330,496 |
| 2021 | $5,281 | $500,564 | $194,000 | $306,564 |
| 2020 | $14,455 | $496,080 | $186,000 | $310,080 |
| 2019 | $14,455 | $496,080 | $186,000 | $310,080 |
| 2018 | $13,608 | $457,368 | $186,000 | $271,368 |
| 2017 | $13,149 | $457,368 | $186,000 | $271,368 |
| 2016 | $11,424 | $397,368 | $126,000 | $271,368 |
| 2015 | $7,535 | $255,784 | $126,000 | $129,784 |
| 2014 | $6,580 | $231,384 | $0 | $0 |
Source: Public Records
Map
Nearby Homes
- 420 Cherry Hill Dr SE
- 511 Pine Valley Rd SE
- 4010 Paper Mill Rd SE
- 111 Cherry Hill Dr SE
- 4131 Thunderbird Dr SE
- 4161 Thunderbird Dr SE
- 4867 Paper Mill Rd SE
- 459 Atlanta Country Club Dr SE
- 4488 Doral Cir SE Unit 3
- 311 Rolling Rock Rd SE
- 303 Rolling Rock Rd SE
- 4513 Chattahoochee Way SE
- 4511 Chattahoochee Way SE
- 4116 River Cliff Chase SE
- 3863 Streamside Dr SE
- 3940 Riverlook Pkwy SE Unit 103
- 4340 Paper Mill Rd SE
- 420 Tam Oshanter Dr SE
- 340 Pine Valley Rd SE Unit 34
- 330 Pine Valley Rd SE
- 510 Oak Hill Cir SE
- 401 Tam o Shanter Dr
- 401 Tam Oshanter Dr SE
- 0 Tam Oshanter Dr Unit 3229756
- 0 Tam Oshanter Dr
- 320 Pine Valley Rd SE Unit 3
- 421 Tam Oshanter Dr SE
- 501 Oak Hill Cir SE Unit 3
- 381 Pine Valley Rd SE
- 0 Pine Valley Rd SE Unit 8495984
- 0 Pine Valley Rd SE Unit 8272258
- 0 Pine Valley Rd SE Unit 7566612
- 0 Pine Valley Rd SE Unit 7149598
- 0 Pine Valley Rd SE Unit 8262727
- 0 Pine Valley Rd SE Unit 7576999
- 0 Pine Valley Rd SE Unit 8523918
- 0 Pine Valley Rd SE Unit 8378424