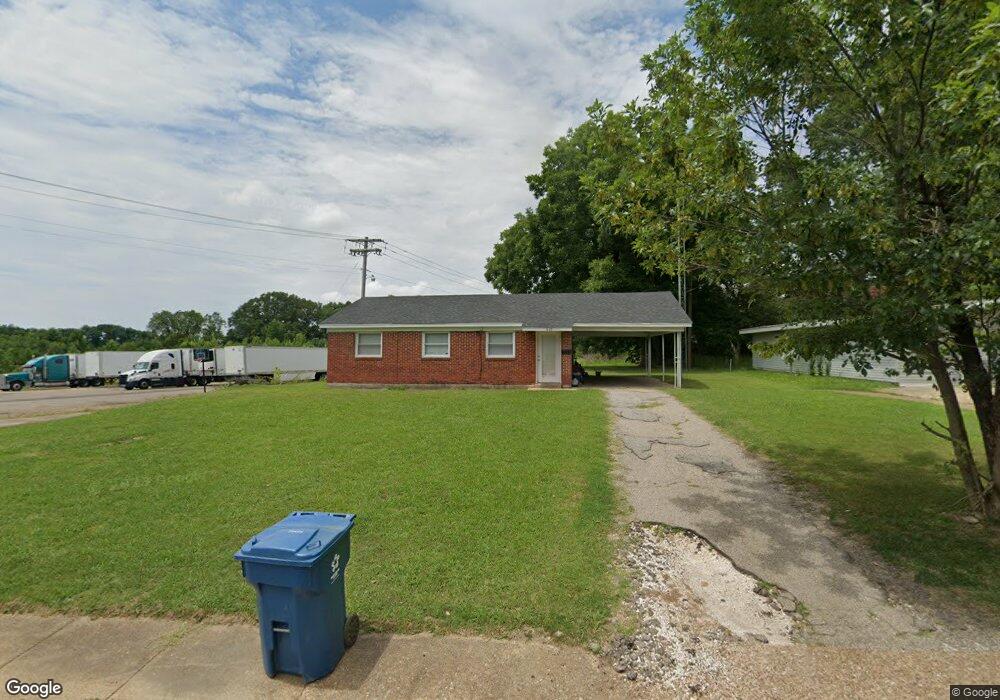
410 W 10th St Trenton, TN 38382
Estimated Value: $77,000 - $124,000
--
Bed
1
Bath
952
Sq Ft
$99/Sq Ft
Est. Value
About This Home
This home is located at 410 W 10th St, Trenton, TN 38382 and is currently estimated at $94,472, approximately $99 per square foot. 410 W 10th St is a home located in Gibson County with nearby schools including Trenton Elementary School, Trenton Middle School, and Peabody High School.
Ownership History
Date
Name
Owned For
Owner Type
Purchase Details
Closed on
Aug 15, 2025
Sold by
Hopkins Richard
Bought by
Mohomes Llc
Current Estimated Value
Purchase Details
Closed on
Sep 23, 2019
Sold by
H & I Investments Llc
Bought by
Rh Holdings Llc
Purchase Details
Closed on
Mar 27, 2012
Sold by
Inman Wesley
Bought by
H & I Investments Llc
Purchase Details
Closed on
Apr 25, 2006
Sold by
Thompson Joe
Bought by
Inman Wesley
Home Financials for this Owner
Home Financials are based on the most recent Mortgage that was taken out on this home.
Original Mortgage
$34,000
Interest Rate
6.33%
Purchase Details
Closed on
Feb 28, 2006
Sold by
Keeling Danny
Bought by
Thompson Joe
Home Financials for this Owner
Home Financials are based on the most recent Mortgage that was taken out on this home.
Original Mortgage
$34,000
Interest Rate
6.33%
Purchase Details
Closed on
Nov 12, 2005
Sold by
Keeling Malcolm
Bought by
Keeling Danny
Create a Home Valuation Report for This Property
The Home Valuation Report is an in-depth analysis detailing your home's value as well as a comparison with similar homes in the area
Home Values in the Area
Average Home Value in this Area
Purchase History
| Date | Buyer | Sale Price | Title Company |
|---|---|---|---|
| Mohomes Llc | $400,000 | Dyer Land Title | |
| Hopkins Richard | -- | Dyer Land Title | |
| Rh Holdings Llc | -- | -- | |
| H & I Investments Llc | -- | -- | |
| Inman Wesley | $30,000 | -- | |
| Thompson Joe | $20,000 | -- | |
| Keeling Danny | -- | -- |
Source: Public Records
Mortgage History
| Date | Status | Borrower | Loan Amount |
|---|---|---|---|
| Previous Owner | Keeling Danny | $34,000 |
Source: Public Records
Tax History Compared to Growth
Tax History
| Year | Tax Paid | Tax Assessment Tax Assessment Total Assessment is a certain percentage of the fair market value that is determined by local assessors to be the total taxable value of land and additions on the property. | Land | Improvement |
|---|---|---|---|---|
| 2024 | $490 | $13,875 | $1,500 | $12,375 |
| 2023 | $271 | $8,450 | $1,500 | $6,950 |
| 2022 | $265 | $8,450 | $1,500 | $6,950 |
| 2021 | $265 | $8,450 | $1,500 | $6,950 |
| 2020 | $403 | $8,450 | $1,500 | $6,950 |
| 2019 | $403 | $8,450 | $1,500 | $6,950 |
| 2018 | $461 | $9,625 | $1,500 | $8,125 |
| 2017 | $456 | $9,625 | $1,500 | $8,125 |
| 2016 | $456 | $9,625 | $1,500 | $8,125 |
| 2015 | $453 | $9,675 | $1,500 | $8,175 |
| 2014 | $446 | $9,675 | $1,500 | $8,175 |
Source: Public Records
Map
Nearby Homes
- 818 S High St
- 823 S High St
- 808 S College St
- 107 W 7th St
- 714 S College St
- 615 S High St
- 1307 Harbert Ave
- 232 Lombardy St
- 300 W 5th St
- 518 S College St
- 301 S Church St
- 711 S Lexington St
- 413 S Church St
- 21 Broadfield
- 229 Hays Ave
- 1411 S College St
- 304 S College St
- 301 Belle Deere Dr
- 712 Gibson St
- 436 E 6th St