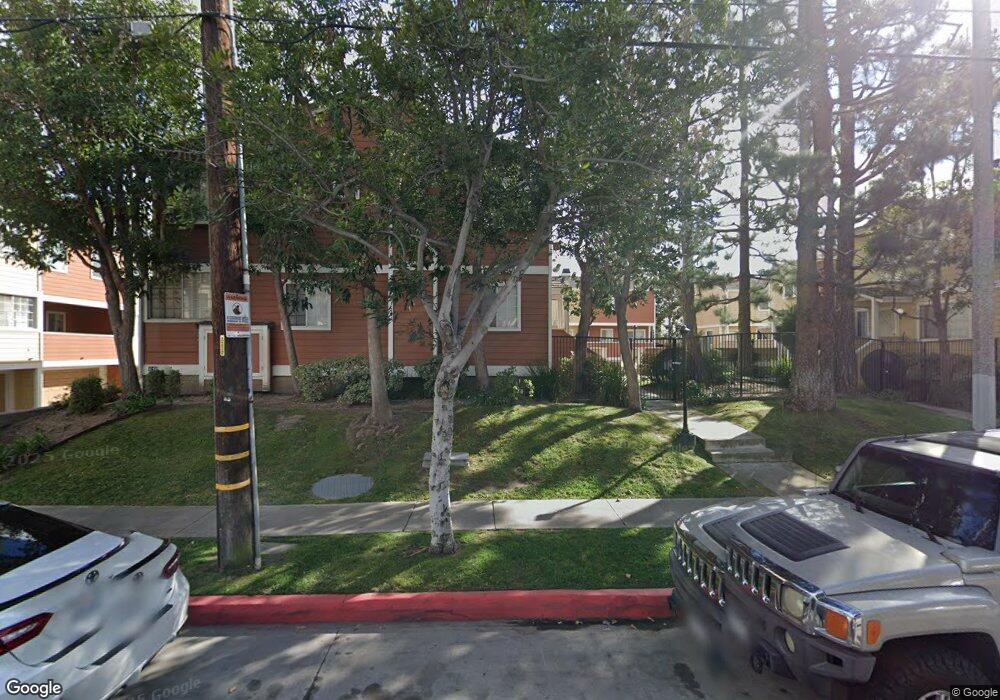
410 W 220th St Unit 2 Carson, CA 90745
Estimated Value: $530,000 - $687,000
3
Beds
3
Baths
1,221
Sq Ft
$485/Sq Ft
Est. Value
About This Home
This home is located at 410 W 220th St Unit 2, Carson, CA 90745 and is currently estimated at $592,381, approximately $485 per square foot. 410 W 220th St Unit 2 is a home located in Los Angeles County with nearby schools including Stephen M. White Middle School, Carson High School, and Academies Of Education And Empowerment.
Ownership History
Date
Name
Owned For
Owner Type
Purchase Details
Closed on
Sep 12, 1996
Sold by
Deridder Alexander I and Deridder Peggy V
Bought by
Keys Betty Jean Wilson
Current Estimated Value
Home Financials for this Owner
Home Financials are based on the most recent Mortgage that was taken out on this home.
Original Mortgage
$137,190
Interest Rate
7.88%
Mortgage Type
VA
Purchase Details
Closed on
Feb 7, 1995
Sold by
Katuuk Ronald J and Katuuk Sylvia I D
Bought by
Deridder Alexander L and Deridder Peggy
Purchase Details
Closed on
Oct 28, 1993
Sold by
Deridder Alexander L
Bought by
Katuuk Ronald J and Katuuk Sylvia I D
Home Financials for this Owner
Home Financials are based on the most recent Mortgage that was taken out on this home.
Original Mortgage
$149,000
Interest Rate
6.85%
Mortgage Type
Seller Take Back
Create a Home Valuation Report for This Property
The Home Valuation Report is an in-depth analysis detailing your home's value as well as a comparison with similar homes in the area
Home Values in the Area
Average Home Value in this Area
Purchase History
| Date | Buyer | Sale Price | Title Company |
|---|---|---|---|
| Keys Betty Jean Wilson | $134,500 | Chicago Title | |
| Deridder Alexander L | -- | North American Title Company | |
| Katuuk Ronald J | $150,000 | Continental Lawyers Title Co |
Source: Public Records
Mortgage History
| Date | Status | Borrower | Loan Amount |
|---|---|---|---|
| Previous Owner | Keys Betty Jean Wilson | $137,190 | |
| Previous Owner | Katuuk Ronald J | $149,000 |
Source: Public Records
Tax History
| Year | Tax Paid | Tax Assessment Tax Assessment Total Assessment is a certain percentage of the fair market value that is determined by local assessors to be the total taxable value of land and additions on the property. | Land | Improvement |
|---|---|---|---|---|
| 2025 | $2,943 | $219,029 | $56,011 | $163,018 |
| 2024 | $2,943 | $214,735 | $54,913 | $159,822 |
| 2023 | $2,891 | $210,526 | $53,837 | $156,689 |
| 2022 | $2,755 | $206,399 | $52,782 | $153,617 |
| 2021 | $2,722 | $202,353 | $51,748 | $150,605 |
| 2019 | $2,634 | $196,353 | $50,214 | $146,139 |
| 2018 | $2,589 | $192,504 | $49,230 | $143,274 |
| 2016 | $2,462 | $185,030 | $47,319 | $137,711 |
| 2015 | $2,418 | $182,252 | $46,609 | $135,643 |
| 2014 | $2,416 | $178,682 | $45,696 | $132,986 |
Source: Public Records
Map
Nearby Homes
- 334 W 220th St
- 413 W 223rd St
- 22031 Main St
- 127 W 219th Place
- 434 W 223rd St
- 715 W 220th St
- 715 W 220th St Unit 47
- 806 W 219th St
- 21602 S Figueroa St
- 21836 S Vermont Ave Unit 6
- 21854 S Vermont Ave Unit 8
- 22230 S Vermont Ave Unit 102B
- 22224 S Vermont Ave Unit 102C
- 22325 Main St Unit 124
- 121 E 223rd St Unit 5
- 121 E 223rd St Unit 3
- 22316 S Vermont Ave Unit 5
- 21314 Kinard Ave
- 946 W 220th St Unit 216
- 21610 Orrick Ave Unit 7
- 410 W 220th St
- 410 W 220th St Unit 1
- 410 W 220th St Unit 22
- 410 W 220th St Unit 21
- 410 W 220th St Unit 20
- 410 W 220th St Unit 19
- 410 W 220th St Unit 18
- 410 W 220th St Unit 17
- 410 W 220th St Unit 16
- 410 W 220th St Unit 15
- 410 W 220th St Unit 14
- 410 W 220th St Unit 13
- 410 W 220th St Unit 12
- 410 W 220th St Unit 11
- 410 W 220th St Unit 10
- 410 W 220th St Unit 9
- 410 W 220th St Unit 8
- 410 W 220th St Unit 7
- 410 W 220th St Unit 6
- 410 W 220th St Unit 5
Your Personal Tour Guide
Ask me questions while you tour the home.