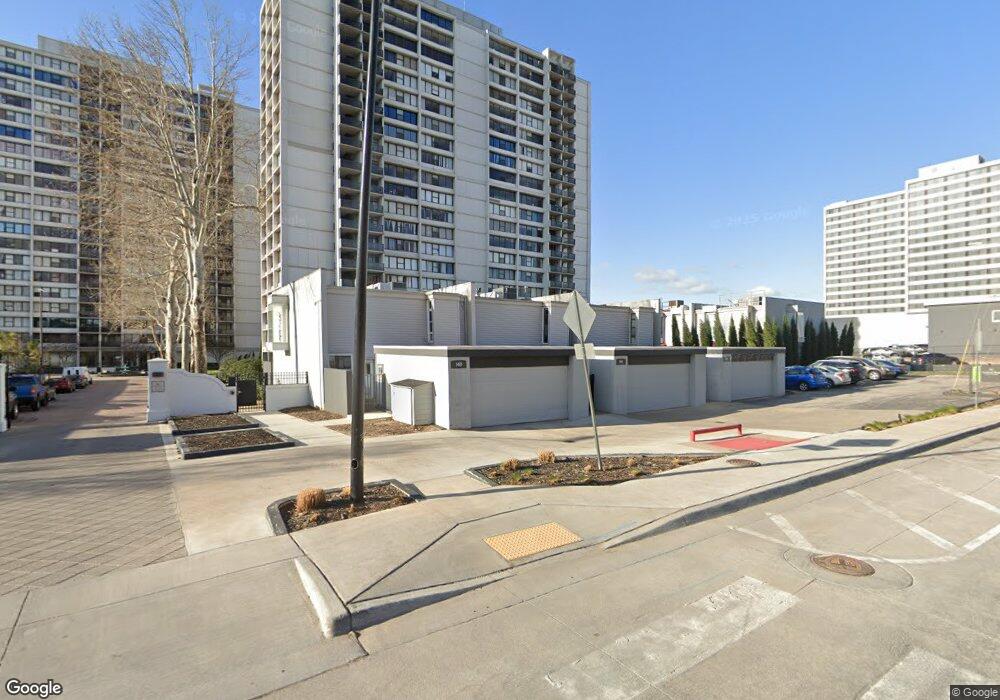
Central Park Residences 410 W 7th St Tulsa, OK 74119
Downtown Tulsa NeighborhoodEstimated Value: $193,000 - $221,000
Studio
3
Baths
1,872
Sq Ft
$111/Sq Ft
Est. Value
About This Home
This home is located at 410 W 7th St, Tulsa, OK 74119 and is currently estimated at $208,691, approximately $111 per square foot. 410 W 7th St is a home located in Tulsa County with nearby schools including Emerson Elementary School, Central Middle School, and Central High School.
Ownership History
Date
Name
Owned For
Owner Type
Purchase Details
Closed on
Jul 13, 2018
Sold by
Somdecerff John and Somdecerff Cindi
Bought by
Nieto Juan
Current Estimated Value
Home Financials for this Owner
Home Financials are based on the most recent Mortgage that was taken out on this home.
Original Mortgage
$118,750
Outstanding Balance
$70,787
Interest Rate
4.6%
Mortgage Type
New Conventional
Estimated Equity
$137,904
Purchase Details
Closed on
Nov 7, 2015
Sold by
Johnson Glory
Bought by
Somdecerff John and Somdecerff Cindi
Purchase Details
Closed on
Jul 30, 2014
Sold by
Federal Home Loan Mortgage Corporation
Bought by
Johnson Glory
Home Financials for this Owner
Home Financials are based on the most recent Mortgage that was taken out on this home.
Original Mortgage
$63,200
Interest Rate
4.19%
Mortgage Type
New Conventional
Purchase Details
Closed on
Feb 25, 2005
Sold by
Arvest Bank
Bought by
Newbury Scott W
Purchase Details
Closed on
Sep 8, 2004
Sold by
Pack Pamela S
Bought by
Arvest Bank and Superior Bank
Create a Home Valuation Report for This Property
The Home Valuation Report is an in-depth analysis detailing your home's value as well as a comparison with similar homes in the area
Home Values in the Area
Average Home Value in this Area
Purchase History
| Date | Buyer | Sale Price | Title Company |
|---|---|---|---|
| Nieto Juan | $125,000 | Guaranty Abstract Co | |
| Somdecerff John | $120,000 | Smith Brothers Abstract & Ti | |
| Johnson Glory | $80,000 | Oklahoma Reo Closing & Title | |
| Newbury Scott W | $68,000 | Frisco Title Corporation | |
| Arvest Bank | -- | -- |
Source: Public Records
Mortgage History
| Date | Status | Borrower | Loan Amount |
|---|---|---|---|
| Open | Nieto Juan | $118,750 | |
| Previous Owner | Johnson Glory | $63,200 |
Source: Public Records
Tax History
| Year | Tax Paid | Tax Assessment Tax Assessment Total Assessment is a certain percentage of the fair market value that is determined by local assessors to be the total taxable value of land and additions on the property. | Land | Improvement |
|---|---|---|---|---|
| 2025 | $1,567 | $11,693 | $2,057 | $9,636 |
| 2024 | $1,745 | $13,750 | $2,057 | $11,693 |
| 2023 | $1,745 | $13,750 | $2,057 | $11,693 |
| 2022 | $1,833 | $13,750 | $2,057 | $11,693 |
| 2021 | $1,816 | $13,750 | $2,057 | $11,693 |
| 2020 | $1,791 | $13,750 | $2,057 | $11,693 |
| 2019 | $1,884 | $13,750 | $2,057 | $11,693 |
| 2018 | $1,676 | $12,200 | $1,901 | $10,299 |
| 2017 | $1,672 | $13,200 | $2,057 | $11,143 |
| 2016 | $1,772 | $13,200 | $2,057 | $11,803 |
| 2015 | $1,864 | $13,860 | $2,057 | $11,803 |
| 2014 | $1,846 | $13,860 | $2,057 | $11,803 |
Source: Public Records
About Central Park Residences
Map
Nearby Homes
- 410 W 7th St Unit 1230
- 410 W 7th St Unit 244
- 410 W 7th St Unit 2026
- 410 W 7th St Unit 1521
- 410 W 7th St Unit 1622
- 410 W 7th St Unit 1023
- 410 W 7th St Unit 324
- 410 W 7th St Unit 1823
- 410 W 7th St Unit 923
- 410 W 7th St Unit 828G
- 410 W 7th St Unit 241
- 410 W 7th St Unit 1921
- 410 W 7th St Unit 1928
- 410 W 7th St Unit 1722
- 410 W 7th St Unit 222
- 410 W 7th St Unit 223
- 410 W 7th St Unit 1430
- 410 W 7th St Unit 523
- 410 W 7th St Unit 226
- 621 S Kenosha Ave
- 410 W 7th St Unit 1523F
- 410 W 7th St Unit 1923
- 410 W 7th St Unit 1024
- 410 W 7th St Unit 425
- 410 W 7th St
- 410 W 7th St Unit 2001623
- 410 W 7th St
- 410 W 7th St Unit 2023
- 410 W 7th St Unit 1323
- 410 W 7th St Unit 1127
- 410 W 7th St
- 410 W 7th St
- 410 W 7th St Unit 1227
- 410 W 7th St Unit 528
- 410 W 7th St
- 410 W 7th St Unit 246
- 410 W 7th St Unit 1028G
- 410 W 7th St Unit 1322D
- 410 W 7th St Unit 627
Your Personal Tour Guide
Ask me questions while you tour the home.